OPEN-SOURCE SCRIPT
Aktualisiert Moving Average Shift [Quantora]
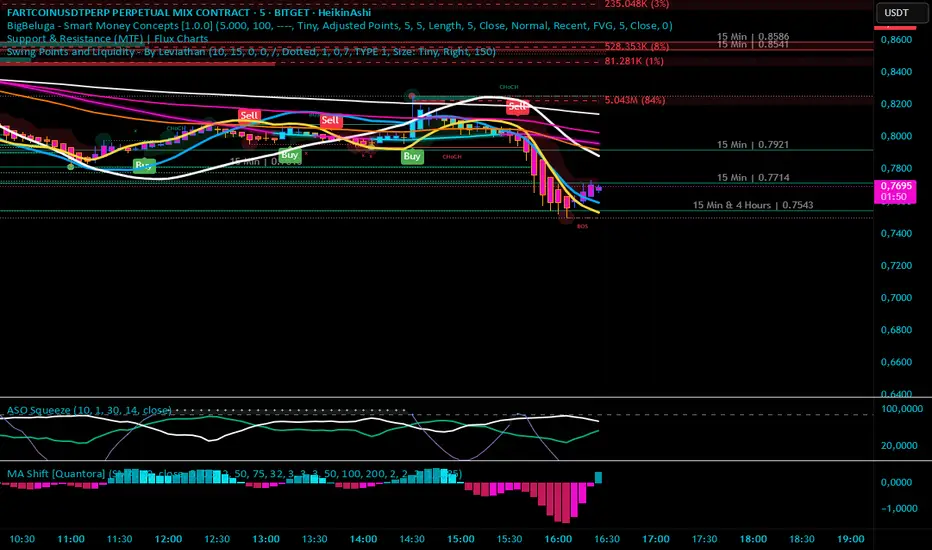
Title: Moving Average Shift [Quantora]
Description:
The Moving Average Shift [Quantora] is a dynamic technical analysis tool designed to help traders better visualize trend strength and direction using a combination of customizable moving averages and a volatility-adjusted oscillator.
🔧 Features:
Multi-Type Moving Average Selection
Choose from SMA, EMA, SMMA (RMA), WMA, and VWMA for your main signal line.
ZLSMA Trio
Three Zero-Lag Smoothed Moving Averages (ZLSMA) with adjustable lengths and colors provide a smoother trend-following structure without the delay of traditional MAs.
EMA Ribbon (50/100/200)
Add clarity to long-term trend direction with layered Exponential Moving Averages in key institutional periods.
Volatility-Adjusted Oscillator
A color-changing oscillator calculated from the normalized deviation between price and the selected MA. This helps identify trend shifts and momentum buildups.
Custom MA Line Widths and Styling
Full control over the width and appearance of all MA lines for visual clarity.
Bar & Candle Coloring
Bars and candles dynamically change color based on the relationship between price and the selected MA — helping you quickly assess bullish/bearish conditions.
📈 How It Helps:
Spot early trend shifts through the oscillator.
Confirm trades using the alignment between ZLSMAs and EMAs.
Quickly assess current trend conditions using color-coded price bars.
Versionshinweise
Description:The Moving Average Shift [Quantora] is a dynamic technical analysis tool designed to help traders better visualize trend strength and direction using a combination of customizable moving averages and a volatility-adjusted oscillator.
🔧 Features:
Multi-Type Moving Average Selection
Choose from SMA, EMA, SMMA (RMA), WMA, and VWMA for your main signal line.
ZLSMA Trio
Three Zero-Lag Smoothed Moving Averages (ZLSMA) with adjustable lengths and colors provide a smoother trend-following structure without the delay of traditional MAs.
EMA Ribbon (50/100/200)
Add clarity to long-term trend direction with layered Exponential Moving Averages in key institutional periods.
Volatility-Adjusted Oscillator
A color-changing oscillator calculated from the normalized deviation between price and the selected MA. This helps identify trend shifts and momentum buildups.
Custom MA Line Widths and Styling
Full control over the width and appearance of all MA lines for visual clarity.
Bar & Candle Coloring
Bars and candles dynamically change color based on the relationship between price and the selected MA — helping you quickly assess bullish/bearish conditions.
Chandelier Exit
📈 How It Helps:
Spot early trend shifts through the oscillator.
Confirm trades using the alignment between ZLSMAs and EMAs.
Quickly assess current trend conditions using color-coded price bars.
Open-source Skript
Ganz im Sinne von TradingView hat dieser Autor sein/ihr Script als Open-Source veröffentlicht. Auf diese Weise können nun auch andere Trader das Script rezensieren und die Funktionalität überprüfen. Vielen Dank an den Autor! Sie können das Script kostenlos verwenden, aber eine Wiederveröffentlichung des Codes unterliegt unseren Hausregeln.
Haftungsausschluss
Die Informationen und Veröffentlichungen sind nicht als Finanz-, Anlage-, Handels- oder andere Arten von Ratschlägen oder Empfehlungen gedacht, die von TradingView bereitgestellt oder gebilligt werden, und stellen diese nicht dar. Lesen Sie mehr in den Nutzungsbedingungen.