OPEN-SOURCE SCRIPT
Aktualisiert Time Frame Color Classifier
Time Frame Colour Classifier
A professional Pine Script indicator that provides instant visual identification of trading sessions through intelligent colour-coded backgrounds.
Key Features
📅 Daily Session Colours
- Monday: Green | Tuesday: Blue | Wednesday: Yellow | Thursday: Red | Friday: Purple
📊 Weekly Classification
- Week 1-5 : Colour-coded by week of the month using the same colour scheme
## How It Works
Intraday Charts (1min-4H) : Shows daily colours - every candle on Monday displays green background, Tuesday shows blue, etc.
Daily/Weekly Charts : Switches to weekly colours - all days in Week 1 show green, Week 2 shows blue, etc.
Professional Applications
✅ Multi-Timeframe Analysis : Seamlessly switch between timeframes whilst maintaining visual context
✅ Session Recognition : Instantly identify which trading day you're analysing
✅ Pattern Analysis : Spot recurring patterns on specific days of the week
✅ Strategy Development : Incorporate temporal factors into trading strategies
✅ Performance Attribution : Correlate results with specific trading sessions
Customisation Options
- Toggle daily/weekly colours on/off
- Fully customisable colour schemes
- Adjustable background transparency
- Optional day labels
Technical Details
- Pine Script v5for optimal performance
- Automatic timeframe detection - no manual configuration required
- Minimal resource usage - won't slow down your charts
- Works on all chart types and timeframes
Perfect For
- Day traders switching between multiple timeframes
- Swing traders analysing weekly patterns
- Algorithmic strategy development
- Multi-timeframe market analysis
- Trading education and research
---
Developed by WYCKOFFNAWAF
Transform your chart analysis with visual timeframe clarity
Versionshinweise
UPDATE: Added horizontal opening lines feature! Now displays high and low lines from the opening candle of each timeframe period. Fully customisable with colour, style, and extension options. Lines auto-reset for new periods - brilliant for support and resistance analysis!Versionshinweise
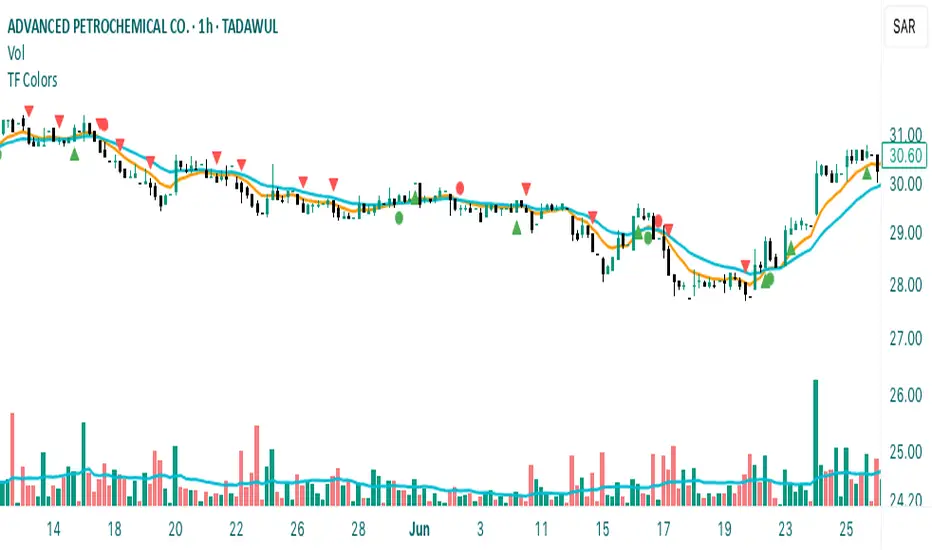
Refined EMA Crossovers: Smaller green/red dots now precisely mark bullish (EMA9 above EMA21) and bearish (EMA9 below EMA21) Exponential Moving Average crossovers.Smart Opening Range Breakout Signals:
A tiny green triangle appears below the first candle breaking the opening high, if the close is above both EMAs.
A tiny red triangle appears above the first candle breaking the opening low, if the close is below both EMAs.
Optional Background Colour: Background colours are now off by default, toggleable in settings.
Open-source Skript
Ganz im Sinne von TradingView hat dieser Autor sein/ihr Script als Open-Source veröffentlicht. Auf diese Weise können nun auch andere Trader das Script rezensieren und die Funktionalität überprüfen. Vielen Dank an den Autor! Sie können das Script kostenlos verwenden, aber eine Wiederveröffentlichung des Codes unterliegt unseren Hausregeln.
Haftungsausschluss
Die Informationen und Veröffentlichungen sind nicht als Finanz-, Anlage-, Handels- oder andere Arten von Ratschlägen oder Empfehlungen gedacht, die von TradingView bereitgestellt oder gebilligt werden, und stellen diese nicht dar. Lesen Sie mehr in den Nutzungsbedingungen.