OPEN-SOURCE SCRIPT
Aktualisiert [blackcat] L3 Swing Trading Zones
Level 3
Background
For swing trading, I consider a combination of multiple technical indicators to indicate periods of long and short positions.
Function
First, judge the daily-level long and short recommendations by the J value of the KDJ indicator in the weekly cycle. in addition. Second, draw bull-bear lines by integrating existing technical indicators such as rsi, adx, cci, dmi, etc. The bull line is above 0, the bear line is below 0, and the other is offsetting each other. When both are relatively close to the zero axis, it means that the strength is equal, and there will be signs of sideways.
Remarks
"D" timeframe ONLY.
Feedbacks are appreciated.
Versionshinweise
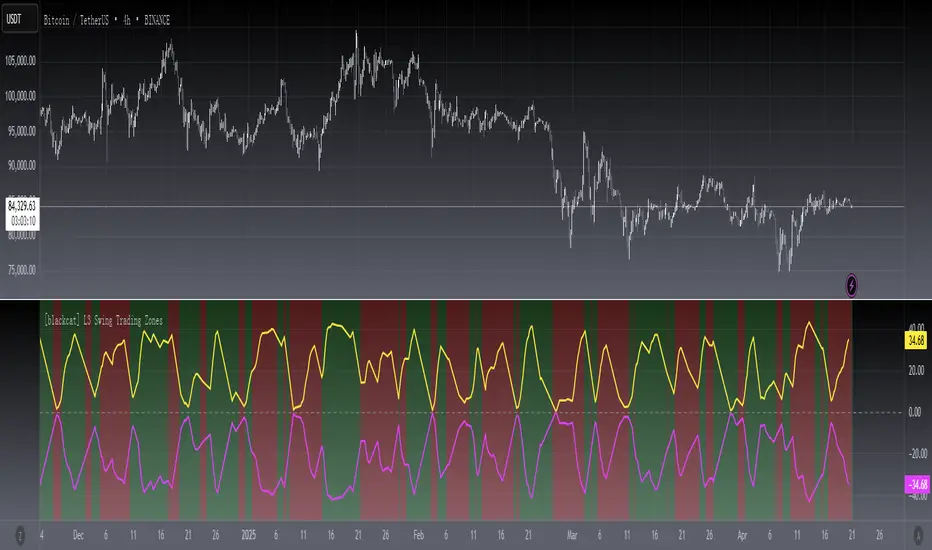
OVERVIEWThe [blackcat] L3 Swing Trading Zones indicator is designed to help traders identify potential swing trading opportunities by analyzing various technical factors. This script combines multiple indicators and algorithms to highlight key zones where price movements are likely to reverse or continue. By plotting these zones on the chart, traders can make more informed decisions about entering and exiting trades 📈💹.
FEATURES
Combines several technical indicators for comprehensive analysis:
KDJ: A momentum oscillator similar to Stochastic.
RSI-based calculations: Relative Strength Index variations.
CCI-based calculations: Commodity Channel Index variations.
DMI-based calculations: Directional Movement Index variations.
Swing Alpha/Beta: Custom indicators for identifying swing points.
Plots key zones on the chart using distinct colors:
Yellow lines indicate potential buy zones.
Fuchsia lines indicate potential sell zones.
Uses background coloring to highlight bullish and bearish trends:
Green background for bullish trends.
Red background for bearish trends.
HOW TO USE
Add the indicator to your TradingView chart by selecting it from the indicators list.
Adjust the parameters (n1, n2, n3) as needed to fine-tune the sensitivity of the indicator ⚙️.
Observe the plotted yellow and fuchsia lines on the chart to identify potential swing trading zones.
Use the background coloring as additional context for market sentiment analysis.
Combine this indicator with other forms of analysis for more reliable trading decisions.
LIMITATIONS
The indicator may generate false signals in highly volatile or ranging markets 🌪️.
Users should always confirm signals with other tools before making trading decisions.
The effectiveness of the indicator may vary depending on the asset and timeframe being analyzed.
NOTES
Ensure that you have sufficient historical data available for accurate calculations.
Test the indicator thoroughly on demo accounts before applying it to live trading 🔍.
Customize the appearance and parameters as needed to fit your trading strategy.
Open-source Skript
Ganz im Sinne von TradingView hat dieser Autor sein/ihr Script als Open-Source veröffentlicht. Auf diese Weise können nun auch andere Trader das Script rezensieren und die Funktionalität überprüfen. Vielen Dank an den Autor! Sie können das Script kostenlos verwenden, aber eine Wiederveröffentlichung des Codes unterliegt unseren Hausregeln.
Avoid losing contact!Don't miss out! The first and most important thing to do is to join my Discord chat now! Click here to start your adventure: discord.com/invite/ZTGpQJq 防止失联,请立即行动,加入本猫聊天群: discord.com/invite/ZTGpQJq
Haftungsausschluss
Die Informationen und Veröffentlichungen sind nicht als Finanz-, Anlage-, Handels- oder andere Arten von Ratschlägen oder Empfehlungen gedacht, die von TradingView bereitgestellt oder gebilligt werden, und stellen diese nicht dar. Lesen Sie mehr in den Nutzungsbedingungen.