OPEN-SOURCE SCRIPT
Stochastic RSI rainbow in fibonacci sequence using VWMA
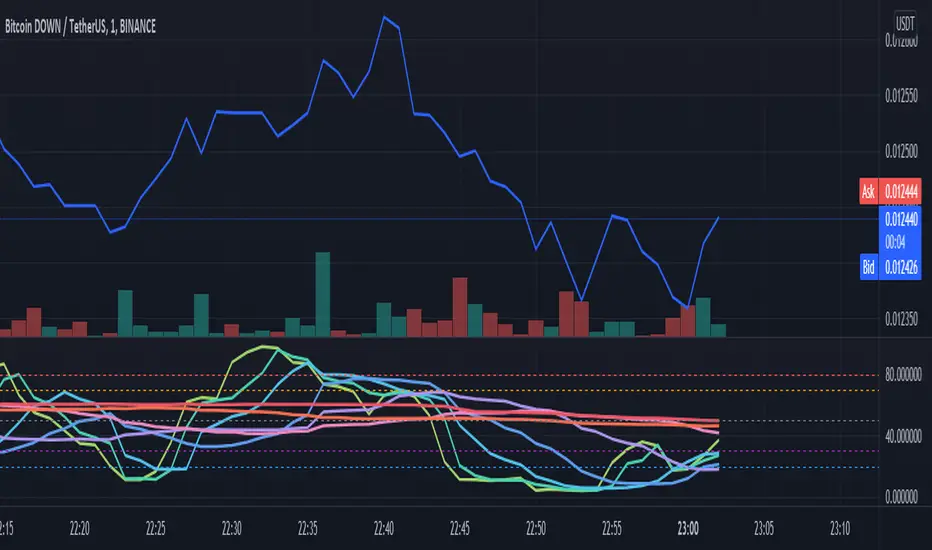
The standard stochastic RSI gives limited information as it only contains two reference lines. This Stochastic RSI rainbow contains more lines in shorter timeframes and progressively fewer as the reference time increase. This is done in a FIB sequence 2,3,8,13,21,34,55.... The shorter timeframes are more reactive to current market conditions indicating recent price action and the longer lines represent more significant periods of time. The indicator uses VWMA for its calculations (volume weighted moving average)
HOW TO USE THIS INDICATOR:
When multiple lines are above, either 70 or 80, you can consider the commodity overbought, or OB. The more lines that are above the threshhold, the more significant the signal. The same is true in inverse. In addition, you can use each cross to signify a buy/sell signal according to the type and quantity of trading you are doing. If you are looking to get in and out quickly you can use the lower timeframe signals.
OPTIONS:
You can change what data is used for the VWMA calculation... Of course, you can select colors and other properties as well.
Open-source Skript
Ganz im Sinne von TradingView hat dieser Autor sein/ihr Script als Open-Source veröffentlicht. Auf diese Weise können nun auch andere Trader das Script rezensieren und die Funktionalität überprüfen. Vielen Dank an den Autor! Sie können das Script kostenlos verwenden, aber eine Wiederveröffentlichung des Codes unterliegt unseren Hausregeln.
Haftungsausschluss
Die Informationen und Veröffentlichungen sind nicht als Finanz-, Anlage-, Handels- oder andere Arten von Ratschlägen oder Empfehlungen gedacht, die von TradingView bereitgestellt oder gebilligt werden, und stellen diese nicht dar. Lesen Sie mehr in den Nutzungsbedingungen.