OPEN-SOURCE SCRIPT
Aktualisiert Sizeblock
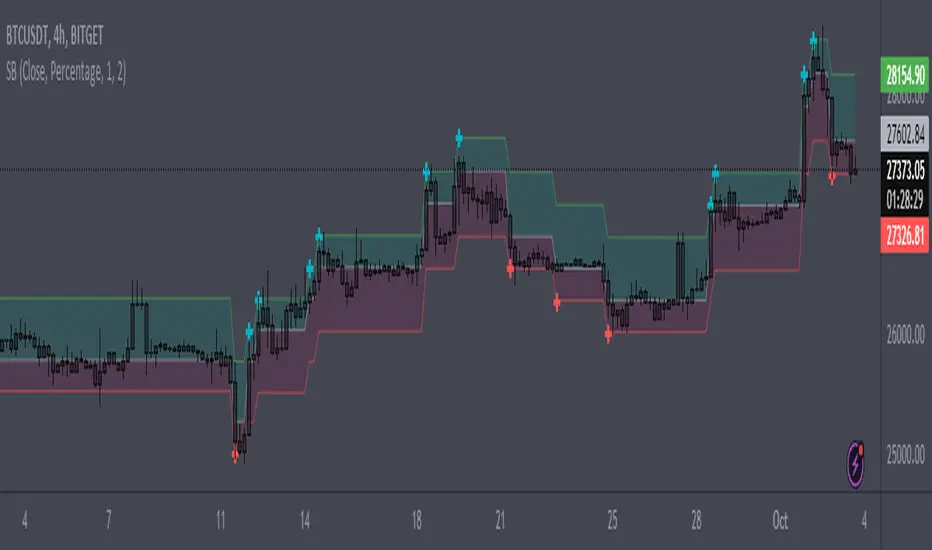
Price change indicator in the form of diagonal rows.
The calculation is based on the percentage or tick deviation of the price movement (indicated in the "Deviation" parameter), which is displayed on the chart in the form of rows.
The row consists of the base middle line, upper and lower limits:
The base middle line is equal to the upper or lower limits of the previous row (if the price changes rapidly in one time interval, then the base middle line of the current row is greater than the upper limit of the previous row or less than the lower limit of the previous row by an equal number of deviations depending on the direction of price movement). At the beginning of the calculation, the base middle line is equal to the initial value of the first row.
The "Quantity" parameter determines the deviation for the upper or lower limits depending on the direction of the price movement, and the "U-turn" parameter determines the deviation for changing the direction of the price movement.
The rule for constructing a new row:
By adjusting certain deviations, you can clearly see the local trend and reversal points on the chart.
A useful tool for tracking price direction.
Thanks for your attention!
The calculation is based on the percentage or tick deviation of the price movement (indicated in the "Deviation" parameter), which is displayed on the chart in the form of rows.
The row consists of the base middle line, upper and lower limits:
- The middle line is the basis for the upper and lower limits of the current row.
- The upper and lower limits are deviations from the base middle line of the current row.
The base middle line is equal to the upper or lower limits of the previous row (if the price changes rapidly in one time interval, then the base middle line of the current row is greater than the upper limit of the previous row or less than the lower limit of the previous row by an equal number of deviations depending on the direction of price movement). At the beginning of the calculation, the base middle line is equal to the initial value of the first row.
The "Quantity" parameter determines the deviation for the upper or lower limits depending on the direction of the price movement, and the "U-turn" parameter determines the deviation for changing the direction of the price movement.
The rule for constructing a new row:
- The "Source" parameter accepts, depending on the choice, the price of high, low values or the closing price from the time interval of the chart.
- When the price reaches the upper or lower limits of the row and goes beyond them, a new row is formed with the same parameters for deviation of the upper and lower limits from the base middle line, depending on the direction of price movement.
By adjusting certain deviations, you can clearly see the local trend and reversal points on the chart.
A useful tool for tracking price direction.
Thanks for your attention!
Versionshinweise
Updating code.Versionshinweise
Updating chart.Open-source Skript
Ganz im Sinne von TradingView hat dieser Autor sein/ihr Script als Open-Source veröffentlicht. Auf diese Weise können nun auch andere Trader das Script rezensieren und die Funktionalität überprüfen. Vielen Dank an den Autor! Sie können das Script kostenlos verwenden, aber eine Wiederveröffentlichung des Codes unterliegt unseren Hausregeln.
Haftungsausschluss
Die Informationen und Veröffentlichungen sind nicht als Finanz-, Anlage-, Handels- oder andere Arten von Ratschlägen oder Empfehlungen gedacht, die von TradingView bereitgestellt oder gebilligt werden, und stellen diese nicht dar. Lesen Sie mehr in den Nutzungsbedingungen.
Open-source Skript
Ganz im Sinne von TradingView hat dieser Autor sein/ihr Script als Open-Source veröffentlicht. Auf diese Weise können nun auch andere Trader das Script rezensieren und die Funktionalität überprüfen. Vielen Dank an den Autor! Sie können das Script kostenlos verwenden, aber eine Wiederveröffentlichung des Codes unterliegt unseren Hausregeln.
Haftungsausschluss
Die Informationen und Veröffentlichungen sind nicht als Finanz-, Anlage-, Handels- oder andere Arten von Ratschlägen oder Empfehlungen gedacht, die von TradingView bereitgestellt oder gebilligt werden, und stellen diese nicht dar. Lesen Sie mehr in den Nutzungsbedingungen.