OPEN-SOURCE SCRIPT
Aktualisiert Leverage Liquidation Circles/dots/alerts
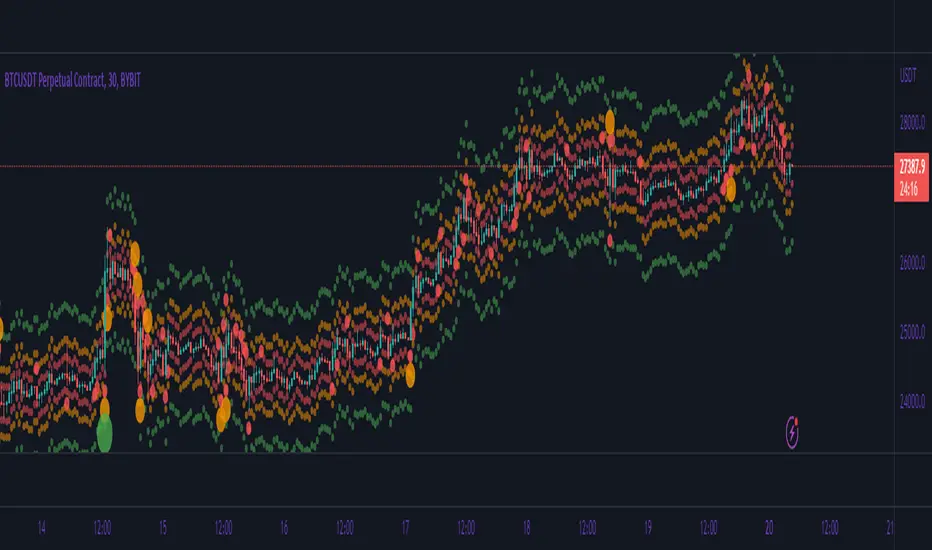
This plots liquidation alerts for different levels of leverage. The script calculates the liquidation prices for both long and short positions based on the inputted leverage values. Then, it plots dots on the chart where liquidation can occur for each level of leverage. Additionally, it plots circles on the chart only when a liquidation event occurs, at which point the circle changes color to indicate the level of leverage that triggered the liquidation.
The script allows traders to visualize potential liquidation events for different levels of leverage, which can be helpful in managing risk when trading on margin. The different colors of the circles can quickly communicate which level of leverage triggered the liquidation, allowing traders to quickly assess the situation and adjust their positions if necessary.
The script allows traders to visualize potential liquidation events for different levels of leverage, which can be helpful in managing risk when trading on margin. The different colors of the circles can quickly communicate which level of leverage triggered the liquidation, allowing traders to quickly assess the situation and adjust their positions if necessary.
Versionshinweise
added highlight on high concentration of dots. still work in progressVersionshinweise
added past liquidation levels. they act as magnets for liquidity + updating to pine v5Versionshinweise
removed some features not meant to be added. added feature that makes dots not visible on the timeframes bigger than 1 hour
Versionshinweise
added more lev circlesadded highlights before vol
Open-source Skript
Ganz im Sinne von TradingView hat dieser Autor sein/ihr Script als Open-Source veröffentlicht. Auf diese Weise können nun auch andere Trader das Script rezensieren und die Funktionalität überprüfen. Vielen Dank an den Autor! Sie können das Script kostenlos verwenden, aber eine Wiederveröffentlichung des Codes unterliegt unseren Hausregeln.
Haftungsausschluss
Die Informationen und Veröffentlichungen sind nicht als Finanz-, Anlage-, Handels- oder andere Arten von Ratschlägen oder Empfehlungen gedacht, die von TradingView bereitgestellt oder gebilligt werden, und stellen diese nicht dar. Lesen Sie mehr in den Nutzungsbedingungen.