OPEN-SOURCE SCRIPT
Aktualisiert Candle Body Percentages Table

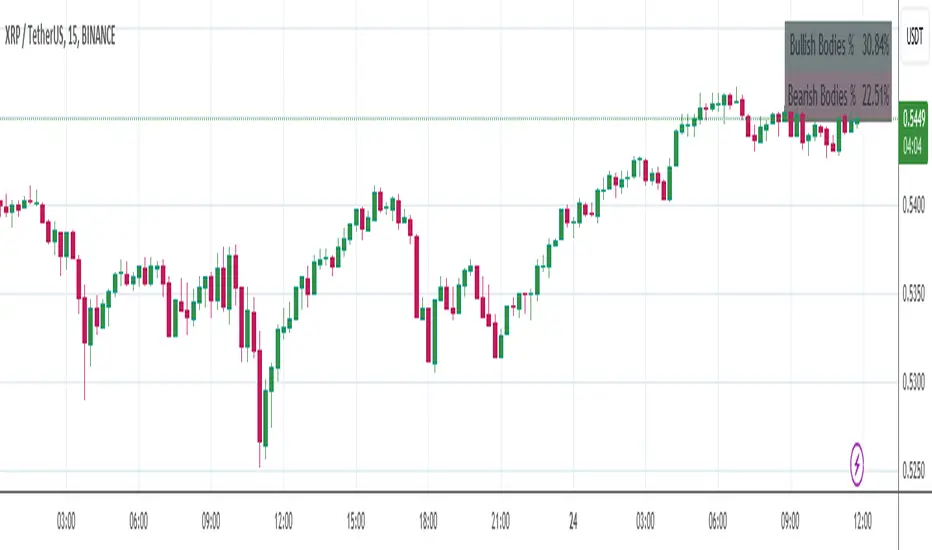
This script is designed as an analysis tool to visually represent the relative strength of bullish and bearish market sentiments over a specified number of candles. It calculates and displays the percentages of bullish and bearish "candle bodies" as part of the total price range observed in the chosen period.
Here's a breakdown of its functionalities:
User-Defined Period Analysis: Users can specify the number of candles they wish to analyze, allowing for flexible and dynamic examination of market trends over different time frames.
Bullish Body Percentage: The script calculates the combined length of all bullish candle bodies (where the closing price is higher than the opening price) within the selected range and expresses this total as a percentage of the combined price range of all candles analyzed.
Bearish Body Percentage: Similarly, it computes the aggregate length of all bearish candle bodies (where the closing price is lower than the opening price) and presents this sum as a percentage of the total price range.
Visual Representation: The results are displayed in a table format on the chart, providing an immediate visual summary of the prevailing market dynamics. The table shows the percentages of price movement dominated by bullish or bearish sentiment.
Market Sentiment Indicator: This tool can be particularly useful for traders and analysts looking to gauge market sentiment. High bullish body percentages might indicate strong buying pressure, while high bearish body percentages could suggest significant selling pressure.
Strategic Decision Making: By providing a clearer picture of market sentiment over a user-defined period, the script aids in making informed trading decisions, potentially enhancing trading strategies that are sensitive to trends and market momentum.
Versionshinweise
Updated script name on chartOpen-source Skript
Ganz im Sinne von TradingView hat dieser Autor sein/ihr Script als Open-Source veröffentlicht. Auf diese Weise können nun auch andere Trader das Script rezensieren und die Funktionalität überprüfen. Vielen Dank an den Autor! Sie können das Script kostenlos verwenden, aber eine Wiederveröffentlichung des Codes unterliegt unseren Hausregeln.
Haftungsausschluss
Die Informationen und Veröffentlichungen sind nicht als Finanz-, Anlage-, Handels- oder andere Arten von Ratschlägen oder Empfehlungen gedacht, die von TradingView bereitgestellt oder gebilligt werden, und stellen diese nicht dar. Lesen Sie mehr in den Nutzungsbedingungen.
Open-source Skript
Ganz im Sinne von TradingView hat dieser Autor sein/ihr Script als Open-Source veröffentlicht. Auf diese Weise können nun auch andere Trader das Script rezensieren und die Funktionalität überprüfen. Vielen Dank an den Autor! Sie können das Script kostenlos verwenden, aber eine Wiederveröffentlichung des Codes unterliegt unseren Hausregeln.
Haftungsausschluss
Die Informationen und Veröffentlichungen sind nicht als Finanz-, Anlage-, Handels- oder andere Arten von Ratschlägen oder Empfehlungen gedacht, die von TradingView bereitgestellt oder gebilligt werden, und stellen diese nicht dar. Lesen Sie mehr in den Nutzungsbedingungen.