OPEN-SOURCE SCRIPT
STY-Divergence
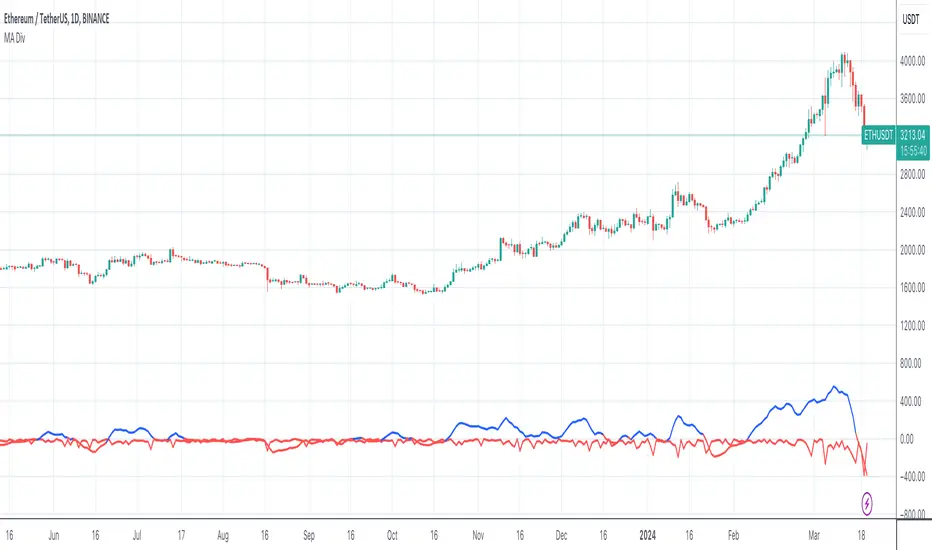
draws a blue line representing the divergence between a 3-period moving average (3MA) close and the current candle high, and a red line representing the divergence between a 20-period moving average (20MA) close and the 3MA close
This script calculates the moving averages for both 3-period and 20-period and then computes the divergences as described. It plots the lines with blue color if the divergence is positive and red if negative. Adjust the length of moving averages or other parameters according to your preference.
This script calculates the moving averages for both 3-period and 20-period and then computes the divergences as described. It plots the lines with blue color if the divergence is positive and red if negative. Adjust the length of moving averages or other parameters according to your preference.
Open-source Skript
Ganz im Sinne von TradingView hat dieser Autor sein/ihr Script als Open-Source veröffentlicht. Auf diese Weise können nun auch andere Trader das Script rezensieren und die Funktionalität überprüfen. Vielen Dank an den Autor! Sie können das Script kostenlos verwenden, aber eine Wiederveröffentlichung des Codes unterliegt unseren Hausregeln.
Haftungsausschluss
Die Informationen und Veröffentlichungen sind nicht als Finanz-, Anlage-, Handels- oder andere Arten von Ratschlägen oder Empfehlungen gedacht, die von TradingView bereitgestellt oder gebilligt werden, und stellen diese nicht dar. Lesen Sie mehr in den Nutzungsbedingungen.