OPEN-SOURCE SCRIPT
Aktualisiert Elliott Wave Auto + Fib Targets + Scalper Strategy (Fixed)
// Elliott Wave Auto + Fib Targets + Scalper Strategy
//
// Fixed by expert trader:
// - Replaced table with label-based visualization to avoid 'Column 2 is out of table bounds' error.
// - Uses label.new to display buy/sell signal counts in top-right corner, mimicking table layout.
// - Fixed array.sum() error: Replaced invalid range-based array.sum() with custom sum_array_range() function.
// - Removed barstate usage to fix 'Undeclared identifier barstate' error.
// - Replaced barstate.isconfirmed with true (process every bar).
// - Replaced barstate.isfirstconfirmed with bar_index == 0 (first bar).
// - Replaced strategy.alert with label.new for long/short entry signals (buy/sell markers).
// - Fixed array index out-of-bounds: Protected array.get() calls with size checks.
// - Fixed pyramiding: Set constant pyramiding=4 (max 5 entries); use allow_pyramiding to limit entries.
// - Fixed default_qty_value: Set constant default_qty_value=100.0; use entry_size_pct to scale qty.
// - Replaced alertcondition with labels for Elliott Wave patterns.
// - Fixed partial exits: 50% at TP1 with fixed SL, 50% at TP2 with fixed SL or trailing.
// - Fixed Elliott Wave pivot indexing for alternating H/L check.
// - Ensured proper position sizing and exit logic.
Versionshinweise
How to Use the Updated ScriptApply to Chart:
Add the script to TradingView on your desired timeframe (e.g., 1H, 4H BTC/USD).
Ensure showPivShapes and showScalpSignals are enabled to display pivot and scalping triangles.
Tune Parameters:
Pivot Detection: Adjust leftBars and rightBars (e.g., 3-5 for 1H, 5-10 for 4H) to optimize pivot detection. Enable debug_pivots to verify pivots.
Scalping: Set min_wave_move (1.5-3.0) and breakout_window (3-5 bars) based on asset volatility. Disable volume_confirm if signals are too sparse.
Trend: Configure trend_ema_len (100-200) for trend alignment.
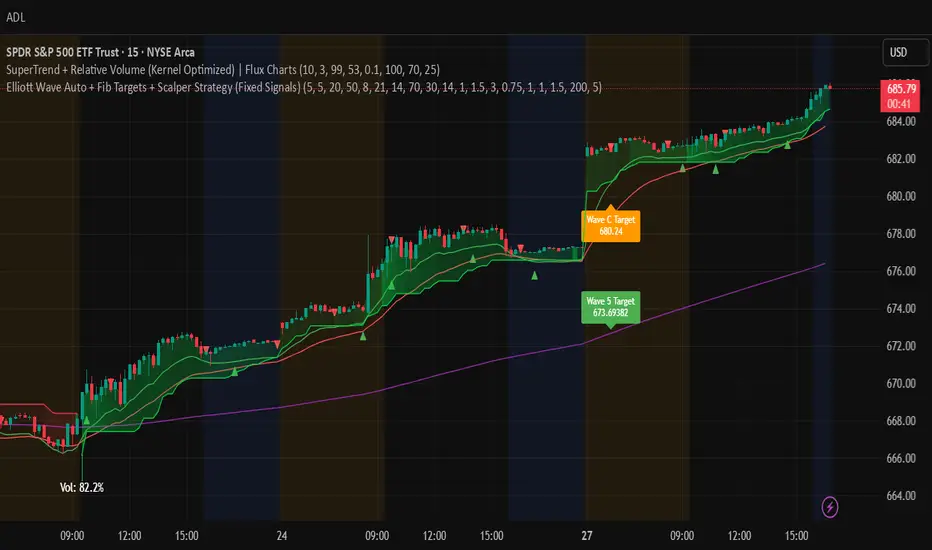
Interpret Signals:
Pivot Triangles: Small red triangles (above bars) for pivot highs, green triangles (below bars) for pivot lows.
Scalping Triangles: Larger green triangles (below bars) for buy signals, red triangles (above bars) for sell signals.
Labels: Green "BUY" and red "SELL" labels confirm trades, purple labels show predictions with confidence.
Debugging: Enable debug_scalp to see "Scalp Buy"/"Scalp Sell" labels, and debug_pivots to verify pivot detection.
Backtesting:
Use TradingView’s strategy tester to evaluate signal frequency and accuracy.
Optimize atr_mult, tp1_rr, tp2_rr, and trail_atr_mult for your asset.
Example Scenario
Chart: 1H BTC/USD, October 27, 2025, 4:51 PM EDT
Pattern: Bullish 12345 completes, ABC correction ends at $65,000 (Wave C high).
Signals:
Pivot triangles: Small green triangle at Wave C low, small red triangle at Wave B high.
Scalping signal: Price breaks above $65,000, triggering long_ok. A large green triangle appears below the bar, with a "BUY" label.
Prediction: Purple label shows entry at $65,200, exit at $67,800 (1.618 Fibonacci), confidence 82%.
Action:
Long at $65,200, SL at $64,500 (Wave 4), TP1 at $66,000, TP2 at $67,800 or trailing.
Justification: Breakout above Wave C, confirmed by EMA, RSI, trend EMA, and volume. Triangles confirm pivot and signal points.
Open-source Skript
Ganz im Sinne von TradingView hat dieser Autor sein/ihr Script als Open-Source veröffentlicht. Auf diese Weise können nun auch andere Trader das Script rezensieren und die Funktionalität überprüfen. Vielen Dank an den Autor! Sie können das Script kostenlos verwenden, aber eine Wiederveröffentlichung des Codes unterliegt unseren Hausregeln.
Haftungsausschluss
Die Informationen und Veröffentlichungen sind nicht als Finanz-, Anlage-, Handels- oder andere Arten von Ratschlägen oder Empfehlungen gedacht, die von TradingView bereitgestellt oder gebilligt werden, und stellen diese nicht dar. Lesen Sie mehr in den Nutzungsbedingungen.