OPEN-SOURCE SCRIPT
Decline and Rise Detective [CHE]
Decline and Rise Detective [CHE]
TradingView Indicator (Best Timeframe: 1H or Higher)
1. Introduction
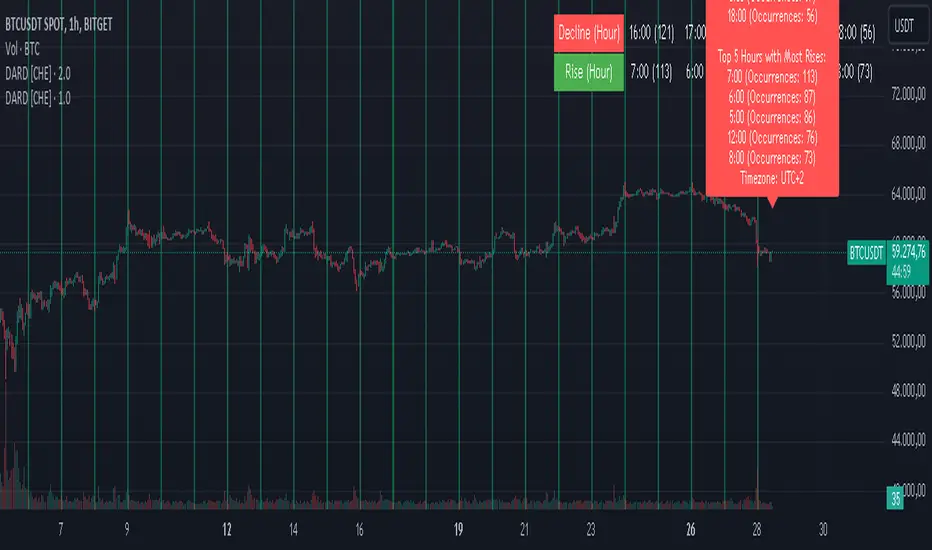
The "Decline and Rise Detective [CHE]" is a TradingView indicator designed to identify the hours within a trading day that experience the largest price declines and rises. This indicator provides a visual representation of this data, offering traders valuable insights into the most frequent hours for significant price movements. It is most effective when used with a timeframe of 1 hour or greater.
2. Key Features of the Indicator
2.1. Display Options
Display Option: Users can choose between two display options:
Label: Displays the information as a text label directly on the chart.
Table: Displays the information in a table format in the top right corner of the chart.
2.2. Time Zone Settings
Time Zone: The indicator allows the user to manually set the time zone or use the exchange's time zone.
Time Zone Offset: Adjust the time zone via a UTC offset.
2.3. Day Change Detection
The indicator automatically detects the change between trading days to ensure data is correctly assigned.
3. Analysis of Price Declines and Rises
3.1. Calculation of Largest Declines and Rises
The indicator compares the high and low of each hour to determine the largest decline and rise within a trading day.
3.2. Frequency Counting
For each hour of the day, the number of times the largest declines and rises occur is counted to identify the hours with the most significant price movements.
3.3. Data Sorting
The hours are sorted by the number of occurrences of declines and rises to highlight the most frequent hours. This sorting was implemented using the MA Sorter function, inspired by Duyck's Array Sorter. Special thanks to Duyck for providing the Array Sorter on TradingView, which greatly influenced this feature
4. Interpretation and Trading Applications
4.1. Identifying High Volatility Periods
The hours identified by the indicator as having the most frequent and significant price movements are typically periods of high volatility. These periods are crucial for traders who seek to capitalize on market fluctuations.
4.2. Determining Optimal Trade Entries
Long Trades: The hours with the most significant price rises can be used to identify optimal times to enter long positions.
Short Trades: Conversely, the hours with the most significant price declines can indicate good opportunities for short trades.
4.3. Display of Top 5 Hours
The indicator shows the five hours with the most declines and rises.
Depending on the selected display option, this information is shown either as a text label or as a table in the chart.
4.4. Background Color
The background color of the chart changes at day change to clearly mark it.
5. Application of the Indicator
5.1. Trading Use
Traders can use the indicator to identify time windows with high volatility and adjust their trading strategies accordingly. This allows for more informed decisions on when to go long or short, depending on the market conditions during those hours.
5.2. Customization Options
Various input options allow the user to customize the indicator to fit personal needs and trading hours.
6. Summary
The "Decline and Rise Detective [CHE]" indicator is a powerful tool for analyzing hourly price movements in the markets. By providing detailed information on the most frequent hours for significant price declines and rises, this indicator offers valuable insights into periods of high volatility. Traders can use this data to make more informed decisions on entering long or short trades. It is particularly effective when used with timeframes of 1 hour or greater.
Best regards and happy trading
Chervolino
TradingView Indicator (Best Timeframe: 1H or Higher)
1. Introduction
The "Decline and Rise Detective [CHE]" is a TradingView indicator designed to identify the hours within a trading day that experience the largest price declines and rises. This indicator provides a visual representation of this data, offering traders valuable insights into the most frequent hours for significant price movements. It is most effective when used with a timeframe of 1 hour or greater.
2. Key Features of the Indicator
2.1. Display Options
Display Option: Users can choose between two display options:
Label: Displays the information as a text label directly on the chart.
Table: Displays the information in a table format in the top right corner of the chart.
2.2. Time Zone Settings
Time Zone: The indicator allows the user to manually set the time zone or use the exchange's time zone.
Time Zone Offset: Adjust the time zone via a UTC offset.
2.3. Day Change Detection
The indicator automatically detects the change between trading days to ensure data is correctly assigned.
3. Analysis of Price Declines and Rises
3.1. Calculation of Largest Declines and Rises
The indicator compares the high and low of each hour to determine the largest decline and rise within a trading day.
3.2. Frequency Counting
For each hour of the day, the number of times the largest declines and rises occur is counted to identify the hours with the most significant price movements.
3.3. Data Sorting
The hours are sorted by the number of occurrences of declines and rises to highlight the most frequent hours. This sorting was implemented using the MA Sorter function, inspired by Duyck's Array Sorter. Special thanks to Duyck for providing the Array Sorter on TradingView, which greatly influenced this feature
4. Interpretation and Trading Applications
4.1. Identifying High Volatility Periods
The hours identified by the indicator as having the most frequent and significant price movements are typically periods of high volatility. These periods are crucial for traders who seek to capitalize on market fluctuations.
4.2. Determining Optimal Trade Entries
Long Trades: The hours with the most significant price rises can be used to identify optimal times to enter long positions.
Short Trades: Conversely, the hours with the most significant price declines can indicate good opportunities for short trades.
4.3. Display of Top 5 Hours
The indicator shows the five hours with the most declines and rises.
Depending on the selected display option, this information is shown either as a text label or as a table in the chart.
4.4. Background Color
The background color of the chart changes at day change to clearly mark it.
5. Application of the Indicator
5.1. Trading Use
Traders can use the indicator to identify time windows with high volatility and adjust their trading strategies accordingly. This allows for more informed decisions on when to go long or short, depending on the market conditions during those hours.
5.2. Customization Options
Various input options allow the user to customize the indicator to fit personal needs and trading hours.
6. Summary
The "Decline and Rise Detective [CHE]" indicator is a powerful tool for analyzing hourly price movements in the markets. By providing detailed information on the most frequent hours for significant price declines and rises, this indicator offers valuable insights into periods of high volatility. Traders can use this data to make more informed decisions on entering long or short trades. It is particularly effective when used with timeframes of 1 hour or greater.
Best regards and happy trading
Chervolino
Open-source Skript
Ganz im Sinne von TradingView hat dieser Autor sein/ihr Script als Open-Source veröffentlicht. Auf diese Weise können nun auch andere Trader das Script rezensieren und die Funktionalität überprüfen. Vielen Dank an den Autor! Sie können das Script kostenlos verwenden, aber eine Wiederveröffentlichung des Codes unterliegt unseren Hausregeln.
Haftungsausschluss
Die Informationen und Veröffentlichungen sind nicht als Finanz-, Anlage-, Handels- oder andere Arten von Ratschlägen oder Empfehlungen gedacht, die von TradingView bereitgestellt oder gebilligt werden, und stellen diese nicht dar. Lesen Sie mehr in den Nutzungsbedingungen.