OPEN-SOURCE SCRIPT
Aktualisiert Bitcoin Cycles Indicator
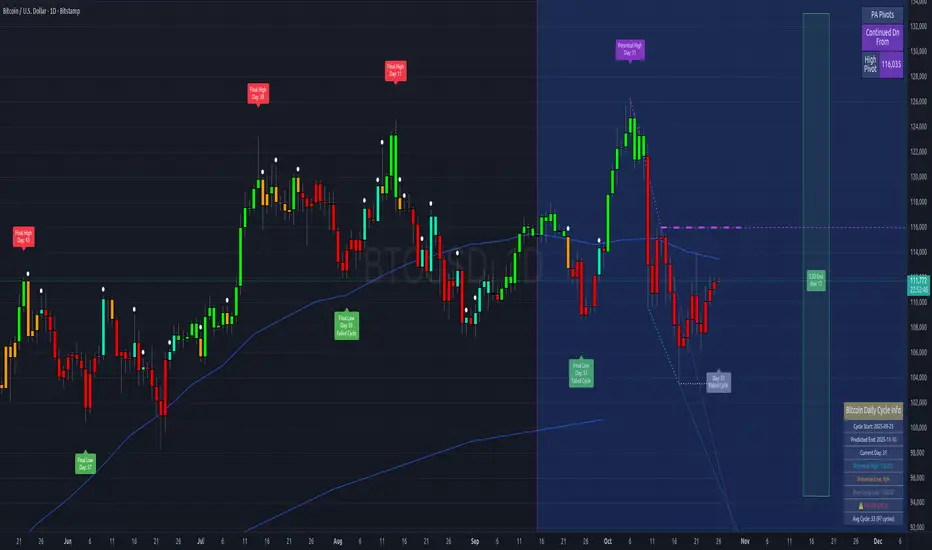
Track Bitcoin's cyclical price patterns across multiple timeframes with this cycle analysis tool. The indicator automatically identifies cycle lows and highs, marking them with clear visual labels that show cycle day counts and failed cycle detection.
Key Features:
Perfect for Bitcoin traders and analysts who want to understand market cycles and timing. Works best on Daily charts for short-term cycles and Weekly/Monthly charts for longer-term analysis.
Key Features:
- Multi-Time frame Support - Optimized settings for Daily, Weekly, Monthly, and Custom time frames
- Cycle Tracking - Identifies and labels cycle lows (green) and highs (red) with day counts
- Failed Cycle Detection - Highlights when cycles break below previous lows
- Customizable Settings - Adjust cycle lengths, colors, and display options for each timeframe
- Info Box - Real-time cycle information display with current cycle day count
- Projection Boxes - Visual cycle length projections for better analysis
Perfect for Bitcoin traders and analysts who want to understand market cycles and timing. Works best on Daily charts for short-term cycles and Weekly/Monthly charts for longer-term analysis.
Versionshinweise
Track Bitcoin's cyclical price patterns across multiple timeframes with this cycle analysis tool. The indicator automatically identifies cycle lows and highs, marking them with clear visual labels that show cycle day counts and failed cycle detection.Key Features:
- Multi-Time frame Support - Optimized settings for Daily, Weekly, Monthly, and Custom time frames
- Cycle Tracking - Identifies and labels cycle lows (green) and highs (red) with day counts
- Failed Cycle Detection - Highlights when cycles break below previous lows
- Customizable Settings - Adjust cycle lengths, colors, and display options for each timeframe
- Info Box - Real-time cycle information display with current cycle day count
- Projection Boxes - Visual cycle length projections for better analysis
Version 1.1 Updates
- Exposed cycle count, cycle highs/lows for strategy use
- Added cycle phase indicators (Active, In Window, Complete)
- Added failed cycle detection flag
- Added cycle timing information (bar indexes)
- Added previous cycle low reference
- Added cycle length settings for reference
Perfect for Bitcoin traders and analysts who want to understand market cycles and timing. Works best on Daily charts for short-term cycles and Weekly/Monthly charts for longer-term analysis.
Versionshinweise
Version 1.2- The Info Box Predicted End date now matches the cycle end projection box
- All timeframes: Initial cycles now properly bounded by min/max cycle length settings
Versionshinweise
█ BITCOIN CYCLES INDICATOR v1.3 - WHAT'S NEW█ DYNAMIC PROJECTION SYSTEM
The indicator now uses intelligent projection boxes that adapt to your data:
- Average Cycle Length: Calculates and uses the average length of completed cycles instead of fixed values
- Dynamic Labels: Shows actual projection length (e.g., "13W End" instead of hardcoded "26W End")
- Real-time Updates: Projection boxes automatically adjust as more cycles complete
- Better Visibility: Minimum box widths ensure proper visibility across all timeframes
█ ENHANCED CYCLE DETECTION
- Improved Failed Cycle Logic: Better detection of failed cycles throughout the entire cycle duration
- Fixed Potential High Calculation: Now correctly identifies the absolute highest high in the cycle
- Minimum Cycle Enforcement: Prevents premature cycle finalization
█ CONFIGURATION UPDATES
- Weekly Defaults: Updated from 20-32 weeks to 5-13 weeks for better medium-term analysis
- License: Changed from Creative Commons to MIT License for broader usage
█ TECHNICAL IMPROVEMENTS
- Syntax Checker: Enhanced local development tools to catch timestamp type errors
- Box Width Calculation: Improved projection box sizing for better visibility
- Label Positioning: More accurate label placement and sizing
█ BUG FIXES
- Fixed potential high label showing incorrect date/price
- Fixed minimum cycle length violation in daily charts
- Fixed weekly projection box centering
- Fixed timestamp type error in str.format_time()
█ HOW TO USE THE NEW FEATURES
- No additional configuration needed - the dynamic projections work automatically
- Watch the projection box labels to see the calculated average cycle length
- The indicator will show more accurate projections as more cycles complete
- Weekly charts now use more appropriate 5-13 week cycle ranges
█ VERSION INFO
Version 1.3 | January 2025 | MIT License
█ DISCLAIMER
This indicator is for educational and analysis purposes only. Not financial advice.
Open-source Skript
Ganz im Sinne von TradingView hat dieser Autor sein/ihr Script als Open-Source veröffentlicht. Auf diese Weise können nun auch andere Trader das Script rezensieren und die Funktionalität überprüfen. Vielen Dank an den Autor! Sie können das Script kostenlos verwenden, aber eine Wiederveröffentlichung des Codes unterliegt unseren Hausregeln.
Haftungsausschluss
Die Informationen und Veröffentlichungen sind nicht als Finanz-, Anlage-, Handels- oder andere Arten von Ratschlägen oder Empfehlungen gedacht, die von TradingView bereitgestellt oder gebilligt werden, und stellen diese nicht dar. Lesen Sie mehr in den Nutzungsbedingungen.