INVITE-ONLY SCRIPT
"EPI" Technical Indicator
Indicator «EPI»
Class: oscillator
Trading type: scalping & averaging
Time frame: 5 min
Purpose: trend based
Level of aggressiveness: standard
Indicator «EPI» is a trend line indicator based on EMA and oscillator for generating intraday trade signals. The EMA is a moving average that places a greater weight and significance on the most recent data points. Like all moving averages, this technical indicator is used to produce buy and sell signals based on crossovers and divergences from the historical average. While the oscillator is used in conjunction with other technical analysis indicators to make trading decisions. This tool helps the trader to identify an entry point even when there is no clear trend line formed on the graph.
Structure of the indicator «EPI»
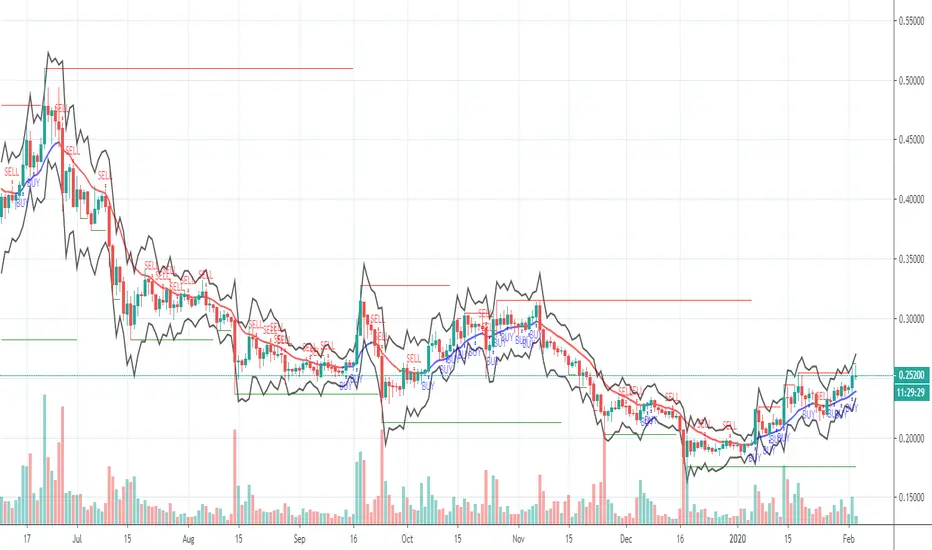
Indicator “EPI” consists of central trend line (EMA line with switches the color between red and blue), price channel, support & resistance (based on Fibonacci level and pivot points) and entry point arrows with blue and red color. The central trend line changes the color changes the color depending on the average trend, blue upwards and red downwards. While green and red horizontal lines indicates to relevant support and resistance levels, blue and red arrows allow the trader t enter the position once they appear
Parameters of the «EPI» indicator
To configure the indicator, the following parameters are provided:
Fast_period = input(5, title="Fast average period")
Slow_period = input(8, title="Slow average period")
Trend_period = input(13, title="Trend period")
Level_width = input(1, title="Level width")
Level_period = input(13, title="Level period")
upper_line = open + ema(range, Level_period) + Level_width*stdev(range, Level_period)
bottom_line = open - ema(range, Level_period) - Level_width*stdev(range, Level_period)
Rules of trading
The indicator is designed to work intraday with time frames 5, 15, 30 mins.
The first step is trend identification. Blue EMA points for upward and red for downwards trend. During upwards trend traders get only buy signals, in downwards only sell signals. Buy signals appear as an arrow with “Blue” color, red as an arrow with “Red” color. Red and Green horizontal lines stand for resistance and support level. In upwards trend the nearest resistance level acts as TP1 while the nearest support acts as SL1. In downwards trend the nearest support level acts as the TP1 level, while the nearest resistance acts as SL1 level.
Class: oscillator
Trading type: scalping & averaging
Time frame: 5 min
Purpose: trend based
Level of aggressiveness: standard
Indicator «EPI» is a trend line indicator based on EMA and oscillator for generating intraday trade signals. The EMA is a moving average that places a greater weight and significance on the most recent data points. Like all moving averages, this technical indicator is used to produce buy and sell signals based on crossovers and divergences from the historical average. While the oscillator is used in conjunction with other technical analysis indicators to make trading decisions. This tool helps the trader to identify an entry point even when there is no clear trend line formed on the graph.
Structure of the indicator «EPI»
Indicator “EPI” consists of central trend line (EMA line with switches the color between red and blue), price channel, support & resistance (based on Fibonacci level and pivot points) and entry point arrows with blue and red color. The central trend line changes the color changes the color depending on the average trend, blue upwards and red downwards. While green and red horizontal lines indicates to relevant support and resistance levels, blue and red arrows allow the trader t enter the position once they appear
Parameters of the «EPI» indicator
To configure the indicator, the following parameters are provided:
Fast_period = input(5, title="Fast average period")
Slow_period = input(8, title="Slow average period")
Trend_period = input(13, title="Trend period")
Level_width = input(1, title="Level width")
Level_period = input(13, title="Level period")
upper_line = open + ema(range, Level_period) + Level_width*stdev(range, Level_period)
bottom_line = open - ema(range, Level_period) - Level_width*stdev(range, Level_period)
Rules of trading
The indicator is designed to work intraday with time frames 5, 15, 30 mins.
The first step is trend identification. Blue EMA points for upward and red for downwards trend. During upwards trend traders get only buy signals, in downwards only sell signals. Buy signals appear as an arrow with “Blue” color, red as an arrow with “Red” color. Red and Green horizontal lines stand for resistance and support level. In upwards trend the nearest resistance level acts as TP1 while the nearest support acts as SL1. In downwards trend the nearest support level acts as the TP1 level, while the nearest resistance acts as SL1 level.
Skript nur auf Einladung
Der Zugriff auf dieses Skript ist auf vom Autor autorisierte User beschränkt und normalerweise kostenpflichtig. Sie können es zu Ihren Favoriten hinzufügen, aber Sie können es nur verwenden, nachdem Sie die Erlaubnis angefordert und vom Autor erhalten haben. Kontaktieren Sie Trade24Fx für weitere Informationen oder folgen Sie den Anweisungen des Autors unten.
TradingView empfiehlt nicht, ein Script zu kaufen, wenn Sie den Autor nicht zu 100 % als vertrauenswürdig halten, oder nicht verstehen, wie das Script funktioniert. In vielen Fällen können Sie auch eine gute und kostenlose Open-Source-Alternative in unseren Community-Scripts entdecken.
Möchten Sie dieses Skript auf einem Chart verwenden?
Warnung: Bitte lesen Sie dies, bevor Sie Zugriff anfordern.
Авторские индикаторы
bit.ly/2oBvkHY
Больше информации на нашем ютьюб-канале
youtube.com/channel/UCYEOurJfasXWyYnrriGwsqQ
bit.ly/2oBvkHY
Больше информации на нашем ютьюб-канале
youtube.com/channel/UCYEOurJfasXWyYnrriGwsqQ
Haftungsausschluss
Die Informationen und Veröffentlichungen sind nicht als Finanz-, Anlage-, Handels- oder andere Arten von Ratschlägen oder Empfehlungen gedacht, die von TradingView bereitgestellt oder gebilligt werden, und stellen diese nicht dar. Lesen Sie mehr in den Nutzungsbedingungen.