OPEN-SOURCE SCRIPT
Aktualisiert Original Bravo Swing
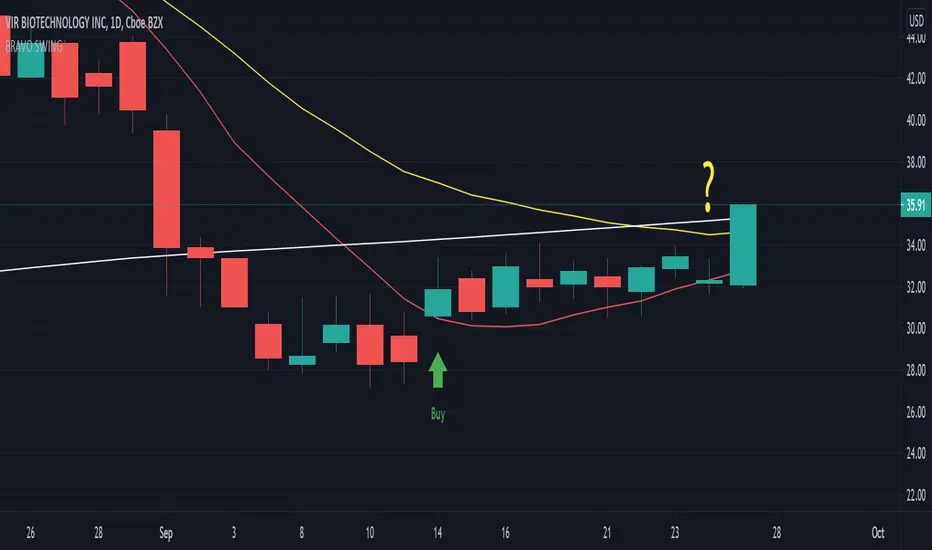
The Bravo Swing is based on the methods taught by YouTube celebrity J Bravo.
It uses the 9 day moving average as a base for selecting optimal entry and exit points.
Buy indicator:
A full candle closing above the 9 day moving average generally indicates a bullish signal for an entry.
If conditions are right, this can be seen as a great opportunity to buy.
Sell indicator:
If the candles continue to close above the 9 day moving average, the trend appears to remain bullish.
However, an exit is to be considered once a candle closes below the 9 day moving average, as this indicates a bearish signal may be approaching.
If you you're feeling confident about the uptrend continuing and choose to ignore the exit signal, a candle close below the 20 day exponential moving average should be used as a definite exit point.
Options:
Color code option to display the 180 day moving average in gray during downtrends and white during an uptrend.
The 50 day moving average can be turned on to help better visualize conflicting trends.
Versionshinweise
The sell indicator now shows ONLY when a red candle closes below the SMA 9 - indicating a strong bearish momentum.A question mark is now displayed when a green candle closes below the SMA 9 - indicating a 'possible' bearish momentum and an early exit should be considered (this can be turned off in settings).
Open-source Skript
Ganz im Sinne von TradingView hat dieser Autor sein/ihr Script als Open-Source veröffentlicht. Auf diese Weise können nun auch andere Trader das Script rezensieren und die Funktionalität überprüfen. Vielen Dank an den Autor! Sie können das Script kostenlos verwenden, aber eine Wiederveröffentlichung des Codes unterliegt unseren Hausregeln.
Haftungsausschluss
Die Informationen und Veröffentlichungen sind nicht als Finanz-, Anlage-, Handels- oder andere Arten von Ratschlägen oder Empfehlungen gedacht, die von TradingView bereitgestellt oder gebilligt werden, und stellen diese nicht dar. Lesen Sie mehr in den Nutzungsbedingungen.