OPEN-SOURCE SCRIPT
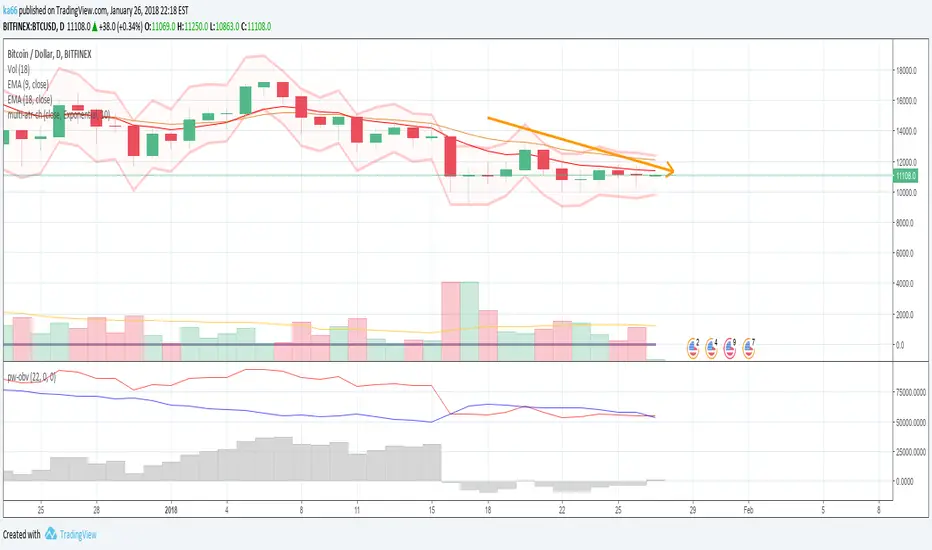
Aktualisiert ka66: Multi ATR Channels

See source code comments for details on difference.
Versionshinweise
See source code comments for enhancements.Changelog:
* Remove redundant calculation, leftover when refactoring.
Versionshinweise
ChangeLog:- Better coloring
- Bug fix: when zero line, should not be visible
Versionshinweise
- Reduce fill transparency, from 99 to 92. Was a bit too subtle!
- And thanks to the convoluted fill logic to prevent colour blending (alas this convoluted logic still exists), configuring the
style from the Style tab was not fun, too many trader-irrelevant colours.
Versionshinweise
- Allow differing MA and ATR lengths, may be useful to compare volatility ranges.
- Allow specifying custom ATR multipliers for all 3 ATRs, instead of having just 1, 2, and 3 by default.
- Visuals: Remove complex fill logic, reduce opacity on fill colours. The negative is we now
get the fills blending with each other, but with reduced opacity, not so jarring. Users are
encouraged to either play with the colors, or simply only plot the ATR channels they are
interested in at different points, generally keeping their charts cleaner. - Visuals: Reduce line width of bands, but increase opacity so it's clearer.
- Visuals: Explicitly plot centre MA with circles.
Versionshinweise
Simplify code further.- Show/Hide of plotlines are now simply handled by the TradingView Style tab in Settings.
- Better descriptions of lines and fills for viewing in the Style tab of Settings.
Open-source Skript
Ganz im Sinne von TradingView hat dieser Autor sein/ihr Script als Open-Source veröffentlicht. Auf diese Weise können nun auch andere Trader das Script rezensieren und die Funktionalität überprüfen. Vielen Dank an den Autor! Sie können das Script kostenlos verwenden, aber eine Wiederveröffentlichung des Codes unterliegt unseren Hausregeln.
Haftungsausschluss
Die Informationen und Veröffentlichungen sind nicht als Finanz-, Anlage-, Handels- oder andere Arten von Ratschlägen oder Empfehlungen gedacht, die von TradingView bereitgestellt oder gebilligt werden, und stellen diese nicht dar. Lesen Sie mehr in den Nutzungsbedingungen.