OPEN-SOURCE SCRIPT
oi + funding oscillator cryptosmart
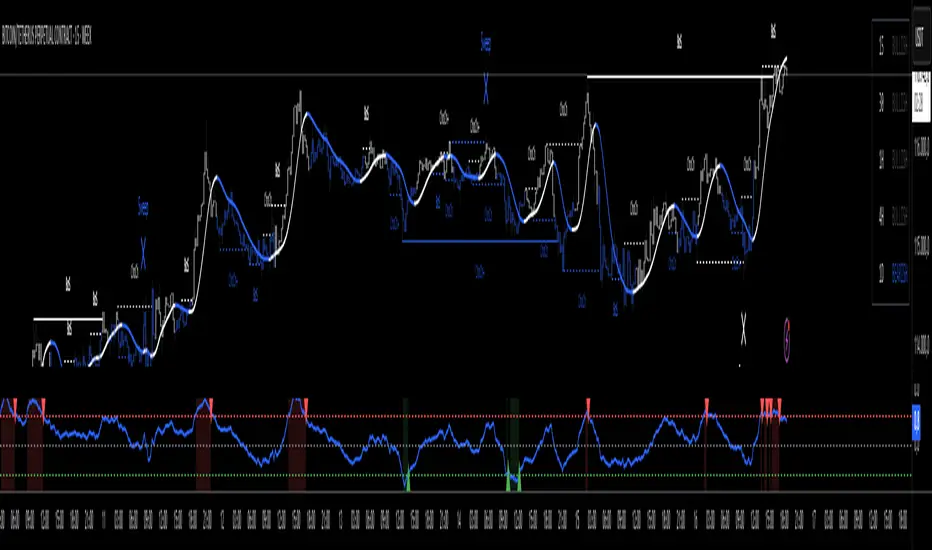
The oi + funding oscillator cryptosmart is an advanced momentum tool designed to gauge sentiment in the crypto derivatives market. It combines Open Interest (OI) changes with Funding Rates, normalizes them into a single oscillator using a z-score, and identifies potential market extremes.
This provides traders with a powerful visual guide to spot when the market is over-leveraged (overheated) or when a significant deleveraging event has occurred (oversold), signaling potential reversals.
How It Works
Combined Data: The indicator tracks the rate of change in Open Interest and the value of Funding Rates.
Oscillator: It blends these two data points into a single, smoothed oscillator line that moves above and below a zero line.
Extreme Zones:
Overheated (Red Zone): When the oscillator enters the upper critical zone, it suggests excessive greed and high leverage, increasing the risk of a sharp correction (long squeeze). A cross below this level generates a potential sell signal.
Oversold (Green Zone): When the oscillator enters the lower critical zone, it indicates panic, liquidations, and a potential market bottom. A cross above this level generates a potential buy signal.
Trading Strategy & Timeframes
This oscillator is designed to be versatile, but its effectiveness can vary depending on the timeframe.
Optimal Timeframes (1H and 4H): The indicator has shown its highest effectiveness on the 1-hour and 4-hour charts. These timeframes are ideal for capturing significant shifts in market sentiment reflected in OI and funding data, filtering out short-term noise while still providing timely reversal signals.
Lower Timeframes (e.g., 1-min, 5-min, 15-min): On shorter timeframes, the oscillator is still a highly effective tool, but it is best used as a confluence factor within a broader trading system. Due to the increased noise on these charts, it is not recommended to use its signals in isolation. Instead, use it as a final argument for entry. For example, if your primary scalping strategy gives you a buy signal, you can check if the oscillator is also exiting the oversold (green) zone to add a powerful layer of confirmation to your trade.
Open-source Skript
Ganz im Sinne von TradingView hat dieser Autor sein/ihr Script als Open-Source veröffentlicht. Auf diese Weise können nun auch andere Trader das Script rezensieren und die Funktionalität überprüfen. Vielen Dank an den Autor! Sie können das Script kostenlos verwenden, aber eine Wiederveröffentlichung des Codes unterliegt unseren Hausregeln.
Haftungsausschluss
Die Informationen und Veröffentlichungen sind nicht als Finanz-, Anlage-, Handels- oder andere Arten von Ratschlägen oder Empfehlungen gedacht, die von TradingView bereitgestellt oder gebilligt werden, und stellen diese nicht dar. Lesen Sie mehr in den Nutzungsbedingungen.