OPEN-SOURCE SCRIPT
MACD Histogram Color Table

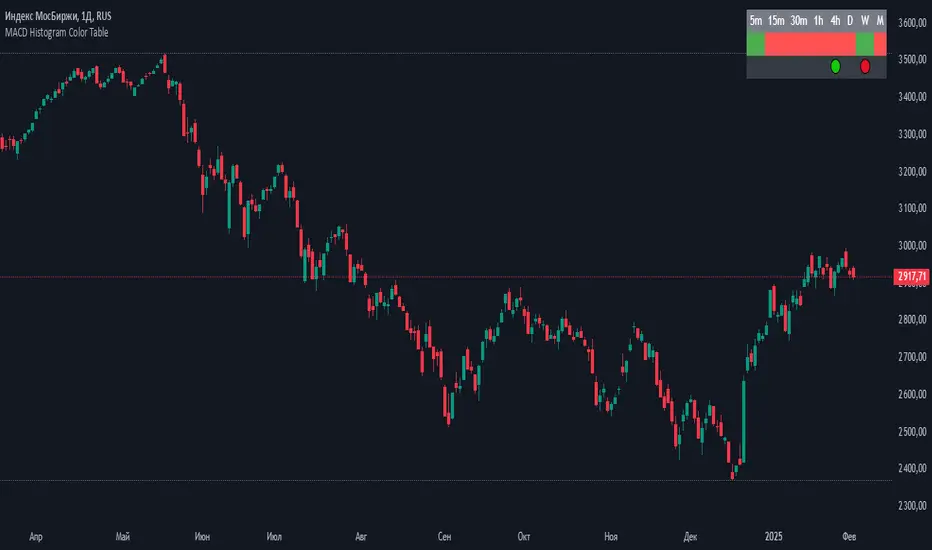
displaying the MACD Histogram color and divergences across multiple timeframes. Here's how it works step by step:
1. Setting the Table Position
The script allows the user to choose where the table will be placed using the positionOption input. The three options are:
Top Right
Top Left
Top Center
Depending on the selected option, the table is created at the corresponding position.
2. Creating the Table
A table (macdTable) is created with 8 columns (for different timeframes) and 3 rows (for different data points).
3. MACD Histogram Color Function (f_get_macd_color)
This function calculates the MACD line, signal line, and histogram for a given timeframe.
The histogram (histLine) is used to determine the cell background color:
Green if the histogram is positive.
Red if the histogram is negative.
4. Divergence Detection Function (f_detect_divergence)
This function looks for bullish and bearish divergences using the MACD histogram:
Bullish Divergence (🟢)
The price makes a lower low.
The MACD histogram makes a higher low.
Bearish Divergence (🔴)
The price makes a higher high.
The MACD histogram makes a lower high.
The function returns:
🟢 (green circle) for bullish divergence.
🔴 (red circle) for bearish divergence.
"" (empty string) if no divergence is detected.
5. Populating the Table
The table has three rows for each timeframe:
First row: Displays the timeframe labels (5m, 15m, 30m, etc.).
Second row: Shows MACD Histogram color (red/green).
Third row: Displays divergences (🟢/🔴).
This is done using table.cell() for each timeframe.
6. Final Result
A table is displayed on the chart.
Each column represents a different timeframe.
The color-coded row shows the MACD histogram status.
The bottom row shows detected divergences.
Open-source Skript
Ganz im Sinne von TradingView hat dieser Autor sein/ihr Script als Open-Source veröffentlicht. Auf diese Weise können nun auch andere Trader das Script rezensieren und die Funktionalität überprüfen. Vielen Dank an den Autor! Sie können das Script kostenlos verwenden, aber eine Wiederveröffentlichung des Codes unterliegt unseren Hausregeln.
Haftungsausschluss
Die Informationen und Veröffentlichungen sind nicht als Finanz-, Anlage-, Handels- oder andere Arten von Ratschlägen oder Empfehlungen gedacht, die von TradingView bereitgestellt oder gebilligt werden, und stellen diese nicht dar. Lesen Sie mehr in den Nutzungsbedingungen.