Hello everyone <3
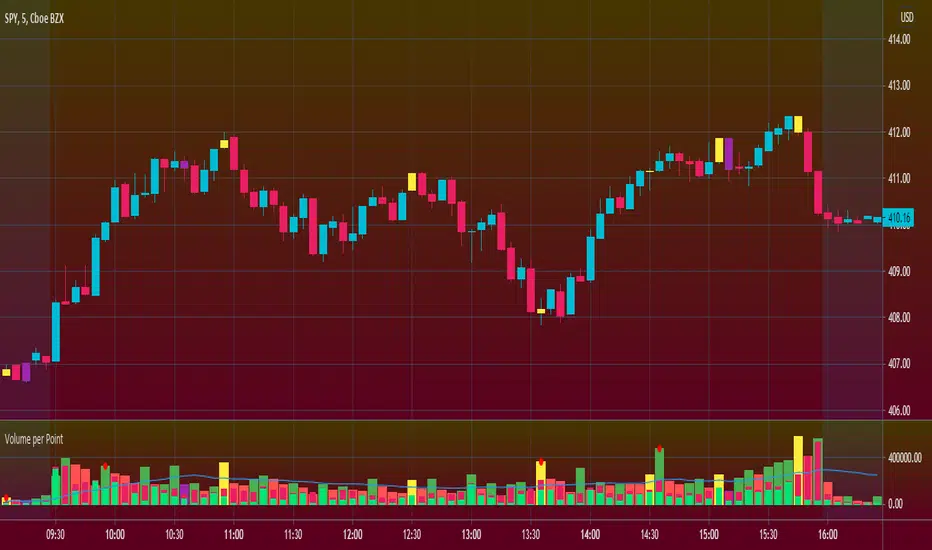
I present to you guys my new indicator Volume per Point (VP)
As suggested by the title, this script gives you the volume for every point.
Here's a run down on specific features:
SUBCHART COLUMNS:
The columns can be the following four colors:
Green - There was an increase in VP
Red - There was a decrease in VP
Yellow - There was divergence between volume and candle range
Purple - There are signs of exhaustion compared to the previous candlestick
SUBCHART HISTOGRAM:
The histogram can be the following two colors:
Lime - Buying volume
Red - Selling volume
I left you guys the ability to change the multiplier on the volume in settings just incase it's too small or too big compared to the VP. Decimals are allowed!
CANDLESTICK CHART:
The candlesticks can the following two colors:
Yellow - There was a divergence between volume and candle range
Purple - There are signs of exhaustion compared to the previous candlestick
FILTERS
In the settings, you're able to add the following two filters:
RSI Filters - RSI must be below or above the specified value for the divergence or exhaustion to trigger
Percent Filters - The candlestick range or volume must be higher or lower than the specified value depending whether it's divergence or exhaustion.
This is a very helpful tool if you're interesting in reading volume. It also facilitates finding market maker activity depending on the size of the VP. Sudden abnormal spikes in VP usually do signal something and that's up for you to figure out :)
Thank you for your time to read this
~July <3
Versionshinweise
Changes:- By default, volume is now disabled
- Now adds a red dot to the subchart column if there it detects an abnormal spike
You can re-enable volume and change the tolerance level for abnormal spikes via the "Multipliers" section in the settings :)
Open-source Skript
Ganz im Sinne von TradingView hat dieser Autor sein/ihr Script als Open-Source veröffentlicht. Auf diese Weise können nun auch andere Trader das Script rezensieren und die Funktionalität überprüfen. Vielen Dank an den Autor! Sie können das Script kostenlos verwenden, aber eine Wiederveröffentlichung des Codes unterliegt unseren Hausregeln.
Haftungsausschluss
Die Informationen und Veröffentlichungen sind nicht als Finanz-, Anlage-, Handels- oder andere Arten von Ratschlägen oder Empfehlungen gedacht, die von TradingView bereitgestellt oder gebilligt werden, und stellen diese nicht dar. Lesen Sie mehr in den Nutzungsbedingungen.