OPEN-SOURCE SCRIPT
0.382 Fibonacci Line of Trailing 1-year Price Range
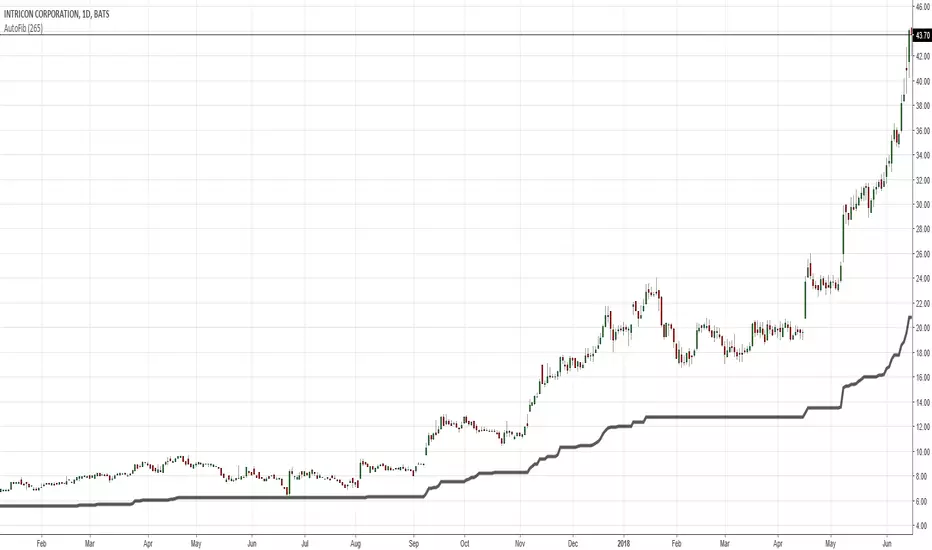
You may try adding this Line to your daily charts. It represents the 0.382 Fibonacci level of the trailing 1-year Price Range.
If price is above this line, then it is in Bullish Territory and long entries can be looked for.
According to backtesting I've done, price being above the 0.382 Fibonacci and/or the 200d sma are the 2 best determinants of
qualifying an equity to be in Bullish Territory on the daily chart.
If price is above this line, then it is in Bullish Territory and long entries can be looked for.
According to backtesting I've done, price being above the 0.382 Fibonacci and/or the 200d sma are the 2 best determinants of
qualifying an equity to be in Bullish Territory on the daily chart.
Open-source Skript
Ganz im Sinne von TradingView hat dieser Autor sein/ihr Script als Open-Source veröffentlicht. Auf diese Weise können nun auch andere Trader das Script rezensieren und die Funktionalität überprüfen. Vielen Dank an den Autor! Sie können das Script kostenlos verwenden, aber eine Wiederveröffentlichung des Codes unterliegt unseren Hausregeln.
Haftungsausschluss
Die Informationen und Veröffentlichungen sind nicht als Finanz-, Anlage-, Handels- oder andere Arten von Ratschlägen oder Empfehlungen gedacht, die von TradingView bereitgestellt oder gebilligt werden, und stellen diese nicht dar. Lesen Sie mehr in den Nutzungsbedingungen.