OPEN-SOURCE SCRIPT
Herd Flow Oscillator — Volume Distribution
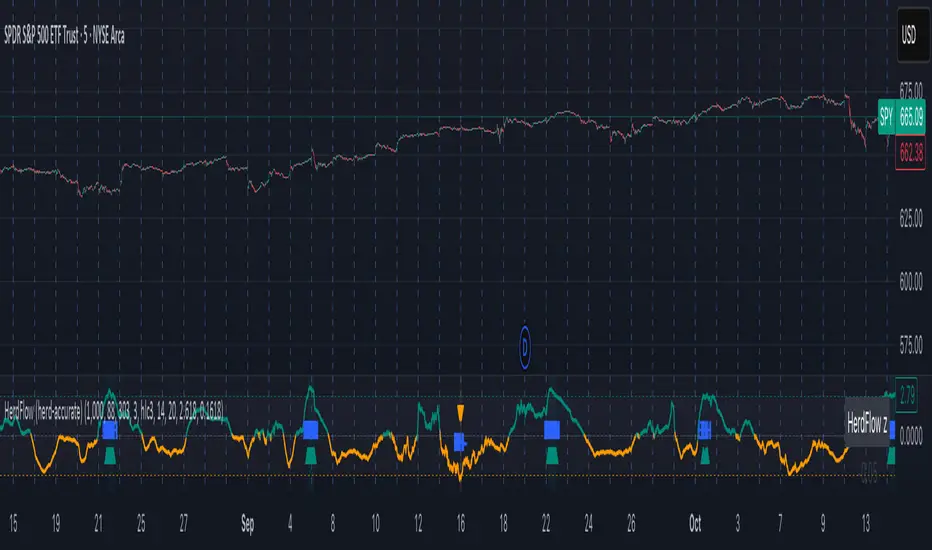
Herd Flow Oscillator — Scientific Volume Distribution (herd-accurate rev)
A composite order-flow oscillator designed to surface true herding behavior — not just random bursts of buying or selling.
It’s built to detect when market participants start acting together, showing persistent, one-sided activity that statistically breaks away from normal market randomness.
Unlike traditional volume or momentum indicators, this tool doesn’t just look for “who’s buying” or “who’s selling.”
It tries to quantify crowd behavior by blending multiple statistical tests that describe how collective sentiment and coordination unfold in price and volume dynamics.
What it shows
The Herd Flow Oscillator works as a multi-layer detector of crowd-driven flow in the market. It examines how signed volume (buy vs. sell pressure) evolves, how persistent it is, and whether those actions are unusually coordinated compared to random expectations.
HerdFlow Composite (z) — the main signal line, showing how statistically extreme the current herding pressure is.
When this crosses above or below your set thresholds, it suggests a high probability of collective buying or selling.
You can optionally reveal component panels for deeper insight into why herding is detected:
DVI (Directional Volume Imbalance): Measures the ratio of bullish vs. bearish volume.
If it’s strongly positive, more volume is hitting the ask (buying); if negative, more is hitting the bid (selling).
LSV-style Herd Index: Inspired by academic finance measures of “herding.”
It compares how often volume is buying vs. selling versus what would happen by random chance.
If the result is significantly above chance, it means traders are collectively biased in one direction.
Order-Flow Persistence (ρ 1..K): Averages autocorrelation of signed volume over several lags.
In simpler terms: checks if buying/selling pressure tends to continue in the same direction across bars.
Positive persistence = ongoing coordination, not just isolated trades.
Runs-Test Herding (−Z): Statistical test that checks how often trade direction flips.
When there are fewer direction changes than expected, it means trades are clustering — a hallmark of herd behavior.
Skew (signed volume): Measures whether signed volume is heavily tilted to one side.
A positive skew means more aggressive buying bursts; a negative skew means more intense selling bursts.
CVD Slope (z): Looks at the slope of the Cumulative Volume Delta — essentially how quickly buy/sell pressure is accelerating.
It’s a short-term flow acceleration measure.
Shapes & background
▲ “BH” at the bottom = Bull Herding; ▼ “BH-” at the top = Bear Herding.
These markers appear when all conditions align to confirm a herding regime.
Persistence and clustering both confirm coordinated downside flow.
Core Windows
Calculation Options
Signal Thresholds
Plotting
How to use it (practical tips)
Threshold tuning:
Denoising:
Reading the components (why signals fire)
A composite order-flow oscillator designed to surface true herding behavior — not just random bursts of buying or selling.
It’s built to detect when market participants start acting together, showing persistent, one-sided activity that statistically breaks away from normal market randomness.
Unlike traditional volume or momentum indicators, this tool doesn’t just look for “who’s buying” or “who’s selling.”
It tries to quantify crowd behavior by blending multiple statistical tests that describe how collective sentiment and coordination unfold in price and volume dynamics.
What it shows
The Herd Flow Oscillator works as a multi-layer detector of crowd-driven flow in the market. It examines how signed volume (buy vs. sell pressure) evolves, how persistent it is, and whether those actions are unusually coordinated compared to random expectations.
HerdFlow Composite (z) — the main signal line, showing how statistically extreme the current herding pressure is.
When this crosses above or below your set thresholds, it suggests a high probability of collective buying or selling.
You can optionally reveal component panels for deeper insight into why herding is detected:
DVI (Directional Volume Imbalance): Measures the ratio of bullish vs. bearish volume.
If it’s strongly positive, more volume is hitting the ask (buying); if negative, more is hitting the bid (selling).
LSV-style Herd Index: Inspired by academic finance measures of “herding.”
It compares how often volume is buying vs. selling versus what would happen by random chance.
If the result is significantly above chance, it means traders are collectively biased in one direction.
Order-Flow Persistence (ρ 1..K): Averages autocorrelation of signed volume over several lags.
In simpler terms: checks if buying/selling pressure tends to continue in the same direction across bars.
Positive persistence = ongoing coordination, not just isolated trades.
Runs-Test Herding (−Z): Statistical test that checks how often trade direction flips.
When there are fewer direction changes than expected, it means trades are clustering — a hallmark of herd behavior.
Skew (signed volume): Measures whether signed volume is heavily tilted to one side.
A positive skew means more aggressive buying bursts; a negative skew means more intense selling bursts.
CVD Slope (z): Looks at the slope of the Cumulative Volume Delta — essentially how quickly buy/sell pressure is accelerating.
It’s a short-term flow acceleration measure.
Shapes & background
▲ “BH” at the bottom = Bull Herding; ▼ “BH-” at the top = Bear Herding.
These markers appear when all conditions align to confirm a herding regime.
Persistence and clustering both confirm coordinated downside flow.
Core Windows
- Primary Window (N) — the main sample length for herding calculations.
- It’s like the "memory span" for detecting coordinated behavior. A longer N means smoother, more reliable signals.
- Short Window (Nshort) — used for short-term measurements like imbalance and slope.
- Smaller values react faster but can be noisy; larger values are steadier but slower.
- Long Window (Nlong) — used for z-score normalization (statistical scaling).
- This helps the indicator understand what’s “normal” behavior over a longer horizon, so it can spot when things deviate too far.
- Autocorr lags (acLags) — how many steps to check when measuring persistence.
- Higher values (e.g., 3–5) look further back to see if trends are truly continuing.
Calculation Options
- Price Proxy for Tick Rule — defines how to decide if a trade is “buy” or “sell.”
- hlc3 (average of high, low, and close) works as a neutral, smooth price proxy.
- Use ATR for scaling — keeps signals comparable across assets and timeframes by dividing by volatility (ATR).
- Prevents high-volatility periods from dominating the signal.
- Median Filter (bars) — smooths out erratic data spikes without heavily lagging the response.
- Odd values like 3 or 5 work best.
Signal Thresholds
- Composite z-threshold — determines how extreme behavior must be before it counts as “herding.”
- Higher values = fewer, more confident signals.
- Imbalance threshold — the minimum directional volume imbalance to trigger interest.
Plotting
- Show component panels — useful for analysts and developers who want to inspect the math behind signals.
- Fill strong herding zones — purely visual aid to highlight key periods of coordinated trading.
How to use it (practical tips)
- Understand the purpose: This is not just a “buy/sell” tool.
- It’s a behavioral detector that identifies when traders or algorithms start acting in the same direction.
- Timeframe flexibility:
- 15m–1h: reveals short-term crowd shifts.
- 4h–1D: better for swing-trade context and institutional positioning.
- Combine with structure or trend:
- When HerdFlow confirms a bullish regime during a breakout or retest, it adds confidence.
- Conversely, a bearish cluster at resistance may hint at a crowd-driven rejection.
Threshold tuning:
- To make it more selective, increase zThr and imbThr.
- To make it more sensitive, lower those thresholds but expand your primary window N for smoother results.
- Cross-market consistency:
- Keep “Use ATR for scaling” enabled to maintain consistency across different instruments or timeframes.
Denoising:
- A small median filter (3–5 bars) removes flicker from volume spikes but still preserves the essential crowd patterns.
Reading the components (why signals fire)
- Each sub-metric describes a unique “dimension” of crowd behavior:
- DVI: how imbalanced buying vs selling is.
- Herd Index: how biased that imbalance is compared to random expectation.
- Persistence (ρ): how continuous those flows are.
- Runs-Test: how clumped together trades are — clustering means the crowd’s acting in sync.
- Skew: how lopsided the volume distribution is — sudden surges of one-sided aggression.
- CVD Slope: how strongly accelerating the current directional flow is.
- When all of these line up, you’re seeing evidence that market participants are collectively moving in the same direction — i.e., true herding.
Open-source Skript
Ganz im Sinne von TradingView hat dieser Autor sein/ihr Script als Open-Source veröffentlicht. Auf diese Weise können nun auch andere Trader das Script rezensieren und die Funktionalität überprüfen. Vielen Dank an den Autor! Sie können das Script kostenlos verwenden, aber eine Wiederveröffentlichung des Codes unterliegt unseren Hausregeln.
Haftungsausschluss
Die Informationen und Veröffentlichungen sind nicht als Finanz-, Anlage-, Handels- oder andere Arten von Ratschlägen oder Empfehlungen gedacht, die von TradingView bereitgestellt oder gebilligt werden, und stellen diese nicht dar. Lesen Sie mehr in den Nutzungsbedingungen.