OPEN-SOURCE SCRIPT
Aktualisiert 10-Year CAGR Calculator: Uncover Long-Term Growth Trends
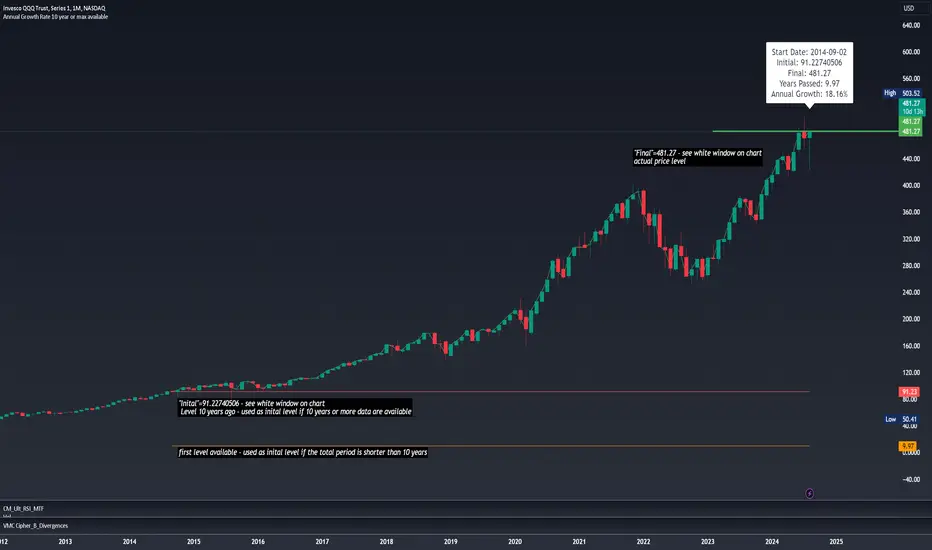
This script calculates the Compound Annual Growth Rate (CAGR) over a 10-year period or the maximum available historical data for any asset. The calculated growth rate is displayed as a label on the last bar of the chart.
Ideal for investors and analysts, this tool helps you easily visualize and assess the long-term growth potential of your investments, providing valuable insights into the historical performance of any asset over an extended period.
Ideal for investors and analysts, this tool helps you easily visualize and assess the long-term growth potential of your investments, providing valuable insights into the historical performance of any asset over an extended period.
Versionshinweise
The indicator created by this code calculates the average annual growth rate of an asset (e.g., a stock, cryptocurrency, etc.) over a 10-year period, or over the longest available period if 10 years of data are not available.Explanation of the Code and How It Works:
Purpose of the Code:
This script calculates how much an asset's value has increased or decreased on average each year over a 10-year period. If 10 years of data are not available, it uses the longest available period.
How Does It Work?
Maximum Period Definition: The code sets the maximum period to 10 years.
Start Date: The script determines the date corresponding to 10 years before the current date.
Initial and Final Values: It records the asset's value at the start of this period (or the earliest available date if 10 years of data aren't available) and compares it to the current value or the most recent value.
Elapsed Time Calculation: The code calculates how much time (in years) has passed between the start date and the current date.
Annual Growth Rate Calculation: The script uses this information to calculate the average annual growth rate of the asset. This rate is expressed as a percentage.
Displaying the Result: Once the rate is calculated, the script displays this percentage on the chart, indicating the average annual growth rate to the user.
How to Use It?
Automatic Display: Once this script is added to a chart in TradingView, it automatically analyzes the historical data of the selected asset and displays the average annual growth rate directly on the chart.
Adaptive Period: If the asset doesn't have 10 years of historical data, the script adapts and calculates the growth rate over the longest available period.
Additional Information: In addition to the growth rate, the script also displays useful information for verification, such as the initial value, final value, elapsed time in years, etc.
Practical Use:
For Investors: This indicator is particularly useful for evaluating the long-term performance of an asset. For example, if you want to know how much a stock has grown on average each year over the last 10 years, this script will tell you.
For Technical Analysts: It helps in better understanding the overall trend of an asset over an extended period, which can assist in making informed investment decisions.
In summary, this code is a powerful tool for analyzing long-term growth trends of an asset, simplifying the calculation of the average annual growth rate, and displaying the results directly on a chart.
Versionshinweise
The indicator created by this code calculates the average annual growth rate of an asset (e.g., a stock, cryptocurrency, etc.) over a 10-year period, or over the longest available period if 10 years of data are not available.Explanation of the Code and How It Works:
Purpose of the Code:
This script calculates how much an asset's value has increased or decreased on average each year over a 10-year period. If 10 years of data are not available, it uses the longest available period.
How Does It Work?
Maximum Period Definition:
The code sets the maximum period to 10 years.
Start Date:
The script determines the date corresponding to 10 years before the current date.
Initial and Final Values:
It records the asset's value at the start of this period (or the earliest available date if 10 years of data aren't available) and compares it to the current value or the most recent value.
Elapsed Time Calculation:
The code calculates how much time (in years) has passed between the start date and the current date.
Annual Growth Rate Calculation:
The script uses this information to calculate the average annual growth rate of the asset. This rate is expressed as a percentage.
Displaying the Result:
Once the rate is calculated, the script displays this percentage on the chart, indicating the average annual growth rate to the user.
How to Use It?
Automatic Display:
Once this script is added to a chart in TradingView, it automatically analyzes the historical data of the selected asset and displays the average annual growth rate directly on the chart.
Adaptive Period: If the asset doesn't have 10 years of historical data, the script adapts and calculates the growth rate over the longest available period.
Wide Applicability:
This indicator can be used on any asset available on TradingView, including stocks, cryptocurrencies, forex pairs, indices, and more.
Additional Information:
In addition to the growth rate, the script also displays useful information for verification, such as the initial value, final value, elapsed time in years, etc.
Practical Use:
For Investors: This indicator is particularly useful for evaluating the long-term performance of any asset available on TradingView. For example, if you want to know how much a stock, cryptocurrency, or any other asset has grown on average each year over the last 10 years, this script will tell you.
For Technical Analysts: It helps in better understanding the overall trend of an asset over an extended period, which can assist in making informed investment decisions.
In summary, this code is a powerful tool for analyzing long-term growth trends of any asset available on TradingView, simplifying the calculation of the average annual growth rate, and displaying the results directly on a chart.
Open-source Skript
Ganz im Sinne von TradingView hat dieser Autor sein/ihr Script als Open-Source veröffentlicht. Auf diese Weise können nun auch andere Trader das Script rezensieren und die Funktionalität überprüfen. Vielen Dank an den Autor! Sie können das Script kostenlos verwenden, aber eine Wiederveröffentlichung des Codes unterliegt unseren Hausregeln.
Haftungsausschluss
Die Informationen und Veröffentlichungen sind nicht als Finanz-, Anlage-, Handels- oder andere Arten von Ratschlägen oder Empfehlungen gedacht, die von TradingView bereitgestellt oder gebilligt werden, und stellen diese nicht dar. Lesen Sie mehr in den Nutzungsbedingungen.