OPEN-SOURCE SCRIPT
Aktualisiert MTF EMA Ribbon & Bands + BB

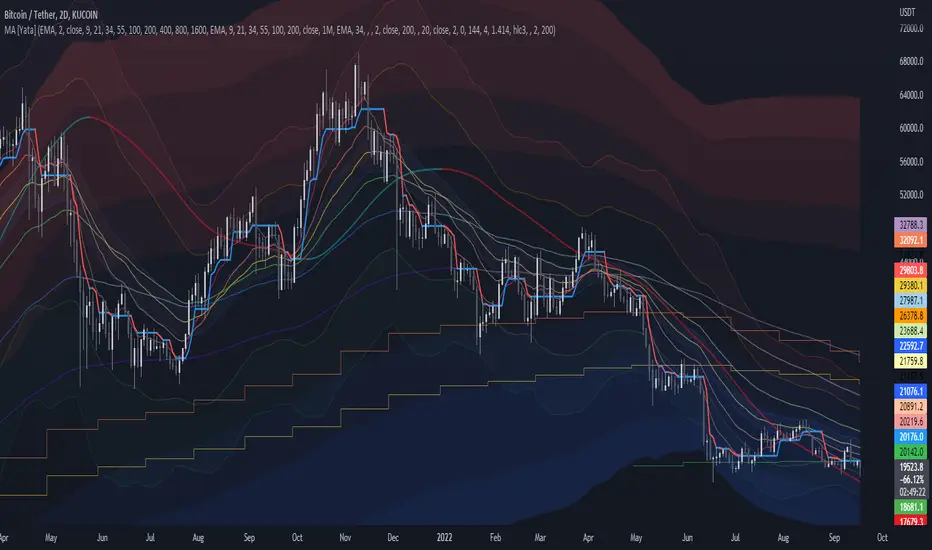
Multi Timeframe Exponential Moving Average Ribbon & Bands + Boillinger Bands
I used the script "EMA Ribbon - low clutter, configurable [aspiers]" by adam24x, I made some color change and I added a few indicators (Boillinger Bands, EMA on multi timeframe and EMA bands from "34 EMA Bands [v2]" by VishvaP).
The script can display various EMA from the chart's timeframe but also EMA from other timeframes.
Bollinger Bands and EMA bands can also be added to the chart.
Versionshinweise
Added "Source" for BB and MTFVersionshinweise
Added "Hull Moving Average" indicatorVersionshinweise
Added the possibility to change the moving average typeVersionshinweise
Added Gradient FillCleaned up the settings menu, changing EMA to MA now that the Moving Average type can be changed
Versionshinweise
Made some changesAdded Rolling VWAP and Standard Deviation Bands (pmk07)
Added HalfTrend line (everget)
Added Gaussian Channel (DonovanWall) with the possibility to change the time frame
Versionshinweise
Made small changesVersionshinweise
Added LSMA typeColors can be edited again in the Style tab
Versionshinweise
Gradient fill only apply to displayed moving averagesOpen-source Skript
Ganz im Sinne von TradingView hat dieser Autor sein/ihr Script als Open-Source veröffentlicht. Auf diese Weise können nun auch andere Trader das Script rezensieren und die Funktionalität überprüfen. Vielen Dank an den Autor! Sie können das Script kostenlos verwenden, aber eine Wiederveröffentlichung des Codes unterliegt unseren Hausregeln.
Haftungsausschluss
Die Informationen und Veröffentlichungen sind nicht als Finanz-, Anlage-, Handels- oder andere Arten von Ratschlägen oder Empfehlungen gedacht, die von TradingView bereitgestellt oder gebilligt werden, und stellen diese nicht dar. Lesen Sie mehr in den Nutzungsbedingungen.
Open-source Skript
Ganz im Sinne von TradingView hat dieser Autor sein/ihr Script als Open-Source veröffentlicht. Auf diese Weise können nun auch andere Trader das Script rezensieren und die Funktionalität überprüfen. Vielen Dank an den Autor! Sie können das Script kostenlos verwenden, aber eine Wiederveröffentlichung des Codes unterliegt unseren Hausregeln.
Haftungsausschluss
Die Informationen und Veröffentlichungen sind nicht als Finanz-, Anlage-, Handels- oder andere Arten von Ratschlägen oder Empfehlungen gedacht, die von TradingView bereitgestellt oder gebilligt werden, und stellen diese nicht dar. Lesen Sie mehr in den Nutzungsbedingungen.
