OPEN-SOURCE SCRIPT
Aktualisiert Encapsulation Box
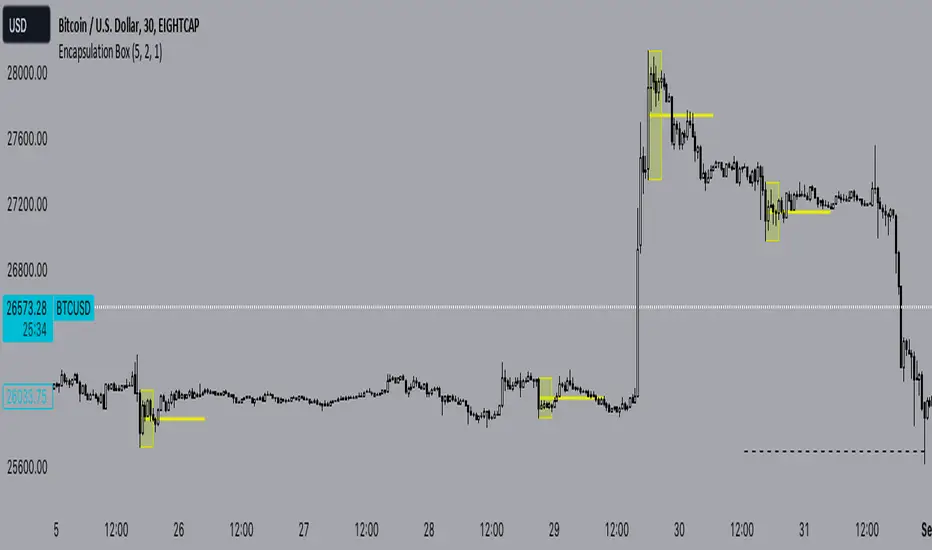
The “Encapsulation Box” indicator is designed to locate areas of the chart where the highs and lows of candlesticks are “embedded” or enclosed within the body of a previous candlestick. This setup indicates a significant contraction in the market and can provide important trading signals. Here's how it works in more detail:
Detecting contraction: The indicator looks for situations where the price range of the candles is very narrow, i.e. when subsequent candles have highs and lows that are contained within the range of a previous candle. This condition indicates a contraction in the market before a possible directional move.
When a contraction is detected, the indicator draws a rectangle around the area where the highs and lows of the candles are embedded. The rectangle has its upper vertex corresponding to the maximum of the candles involved and its lower vertex corresponding to the minimum. The width of the rectangle is defined by can be customized by the user.
A key feature of this indicator is the horizontal line drawn outside the rectangle. This line is positioned in the middle of the rectangle and represents 50% of the range of the rectangle itself. This line acts as a significant support or resistance level depending on the direction the contraction breaks.
The indicator can generate buy or sell signals when a break in the rectangle or horizontal line occurs. For example, if the price breaks above the rectangle and the horizontal line, it could generate a buy signal, indicating a possible uptrend. Conversely, if the price breaks below the rectangle and the horizontal line, it could generate a sell signal, indicating a possible downtrend.
Versionshinweise
Added AlertVersionshinweise
Optimized Alert, in this version it includes the bar index where the new box is formed in the alert messageOpen-source Skript
Ganz im Sinne von TradingView hat dieser Autor sein/ihr Script als Open-Source veröffentlicht. Auf diese Weise können nun auch andere Trader das Script rezensieren und die Funktionalität überprüfen. Vielen Dank an den Autor! Sie können das Script kostenlos verwenden, aber eine Wiederveröffentlichung des Codes unterliegt unseren Hausregeln.
Haftungsausschluss
Die Informationen und Veröffentlichungen sind nicht als Finanz-, Anlage-, Handels- oder andere Arten von Ratschlägen oder Empfehlungen gedacht, die von TradingView bereitgestellt oder gebilligt werden, und stellen diese nicht dar. Lesen Sie mehr in den Nutzungsbedingungen.
Open-source Skript
Ganz im Sinne von TradingView hat dieser Autor sein/ihr Script als Open-Source veröffentlicht. Auf diese Weise können nun auch andere Trader das Script rezensieren und die Funktionalität überprüfen. Vielen Dank an den Autor! Sie können das Script kostenlos verwenden, aber eine Wiederveröffentlichung des Codes unterliegt unseren Hausregeln.
Haftungsausschluss
Die Informationen und Veröffentlichungen sind nicht als Finanz-, Anlage-, Handels- oder andere Arten von Ratschlägen oder Empfehlungen gedacht, die von TradingView bereitgestellt oder gebilligt werden, und stellen diese nicht dar. Lesen Sie mehr in den Nutzungsbedingungen.