Analyse zu J.P. Morgan Chase (JPM)1️⃣ Einschätzung des Managements 🏦📊
Laut der jüngsten Aussagen des Managements sieht JPMorgan sowohl Risiken als auch
Chancen für die Zukunft:
🚨 Risiken:
Wirtschaftliche Unsicherheit 🌍⚠️
Geopolitische Spannungen und wirtschaftliche Abschwünge könnten das Geschäft belasten.
Zinsumfeld 💹📉
Schwankende Zinssätze könnten das Nettozinseinkommen (NII) beeinflussen.
Regulierungen ⚖️
Strengere Kapitalanforderungen (Basel III) könnten Auswirkungen haben.
Kreditrisiken 🏢💳
Potenzielle Risiken im Bereich Gewerbeimmobilien und Verbraucherkredite.
🚀 Chancen:
Starke Konsumenten- & Unternehmenslage 💪💼
Widerstandsfähige Verbraucher und profitable Unternehmen bieten Wachstumspotenzial.
Investment Banking & Kapitalmärkte 📈🏦
Erhöhte M&A- und Underwriting-Aktivitäten können das Geschäft stärken.
Technologische Innovationen 💻📲
Weiterentwicklung digitaler Finanzdienstleistungen und Fintech-Integration.
Internationale Expansion 🌐💸
Wachstum in globalen Märkten, insbesondere im Zahlungsverkehrsbereich.
📊 Das Management bleibt vorsichtig optimistisch und setzt auf eine starke Bilanz, technologischen Fortschritt und globale Expansion, um zukünftige Herausforderungen zu meistern.
2️⃣ Fundamentalanalyse 📈
Umsatz pro Aktie: $58.07 💰
Gewinn pro Aktie (EPS): $20.35 💵
Operative Marge: 35.04% 📊
EPS-Wachstum: 20.66% im letzten Geschäftsjahr 🚀
🏦 Gewinnprognosen für das aktuelle Jahr:
Basierend auf dem EPS-Wachstum und den aktuellen Marktbedingungen wird ein weiteres Wachstum erwartet.
💰 Verschuldung, Cashflow & Dividendenpolitik:
JPMorgan hat eine starke Bilanz und ist bekannt für seine zuverlässigen Dividendenausschüttungen.
3️⃣ Bewertung & Fair Value 📊
KGV (P/E Ratio): 11.78 📊
KUV (P/S Ratio): 4.13 📈
P/B Ratio: 2.00 📚
PEG-Ratio: Nicht direkt verfügbar, aber das KGV in Relation zum EPS-Wachstum deutet auf eine faire Bewertung hin.
📉 Fair Value auf Basis eines DCF-Modells:
Das aktuelle KGV deutet auf eine faire Bewertung im Vergleich zum Sektor hin.
⚖️ Aktueller Kurs vs. Fair Value:
Der aktuelle Kurs scheint im Einklang mit dem fairen Wert zu stehen.
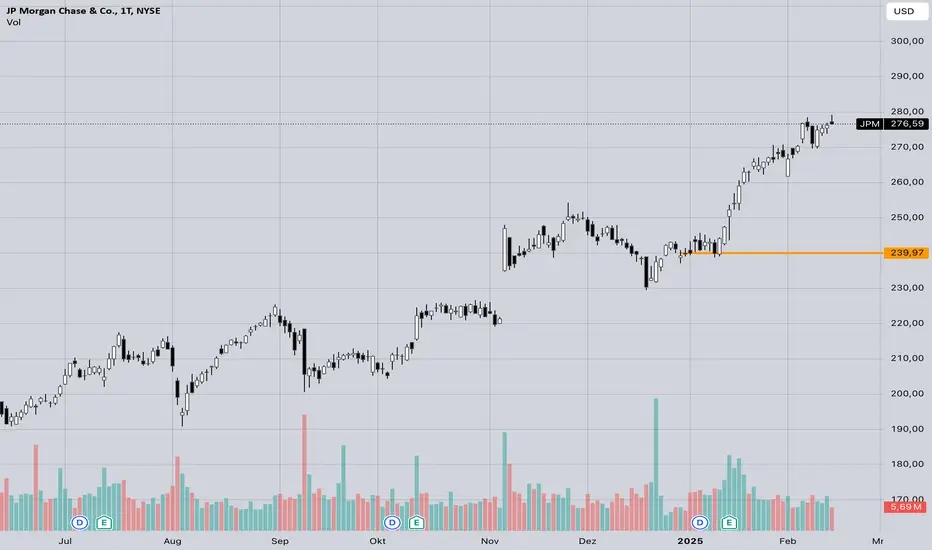
4️⃣ Technische Analyse 📉📈
Aktueller Kurs: $276.59 📈
52-Wochen-Hoch: $279.23 📊
52-Wochen-Tief: $176.15 📉
Der aktuelle Kurs nahe dem 52-Wochen-Hoch deutet auf eine starke technische Position hin.
5️⃣ Wettbewerbsanalyse & Moat 🌍🏦
🔎 Vergleich mit direkten Konkurrenten:
Bank of America & Citigroup sind Hauptkonkurrenten.
JPMorgan hat eine stärkere Marktposition und höhere Margen.
🏰 Wettbewerbsvorteile (Moat):
Starke Marke & Vertrauen 🌍
Diversifiziertes Geschäftsmodell 📈
Technologische Innovationen 💻
⚠️ Risiken:
Strenge Regulierung ⚖️
Makroökonomische Unsicherheiten 📉
6️⃣ SWOT-Analyse 🏆
Stärken 💪
✅ Globale Präsenz 🌐
✅ Starke Bilanz & Finanzkraft 💰
Schwächen ⚖️
❌ Regulierungsdruck
Chancen 🚀
✅ Digitalisierung 📲
✅ Wachstum in Schwellenländern 🌍
Risiken ⚠️
❌ Wirtschaftliche Unsicherheiten 📉
❌ Cybersecurity-Bedrohungen 🔒
7️⃣ Investmentstrategie nach Zeithorizont ⭐
Kurzfristig (0-6 Monate): 📊 ⭐⭐⭐
Potenzial für kurzfristige Gewinne.
Mittelfristig (6-24 Monate): 📈 ⭐⭐⭐⭐
Wachstumschancen durch Digitalisierung.
Langfristig (2+ Jahre): 📉 ⭐⭐⭐⭐⭐
Stabile Buy-and-Hold-Option für langfristige Investoren.
8️⃣ Cash-Secured Put (CSP) Levels 💵
Volatilitätsanalyse: JPMorgan hat eine moderate Volatilität.
Ideale Strike-Preise für CSPs:
Interessant knapp unter dem aktuellen Kurs für Prämienstrategie.
9️⃣ Insideraktivitäten & Institutionelle Investoren 🏦
Insideraktivitäten: Keine relevanten Veränderungen bekannt.
Top-Institutionelle Investoren: Starke institutionelle Unterstützung.
📌 Fazit: Kaufen, Halten oder Verkaufen? 🏁
📊 JPMorgan Chase & Co. ist eine solide langfristige Investition!
Halten oder Kaufen – abhängig von der Strategie. 📈
🔹 Strategien für verschiedene Anlegertypen:
Trader: Kurzfristige Gewinne durch technische Stärke.
Langfristige Investoren: Stabilität & Wachstumspotenzial nutzen.
🔹 Besondere Risiken & Chancen:
Risiken: Strenge Regulierung & wirtschaftliche Unsicherheiten ⚠️
Chancen: Digitalisierung & globale Expansion 🚀
Optionsstrategies
52er Put Coca Cola - Gute Gelegenheit ! Hallo,
kurz zu meiner Person. Ich bin ein typischer Optionsstillhalter und trade hauptsächlich Optionen auf Aktien oder Indizes.
Dadurch das es heute mein ersten Post wird, fange ich mal mit einer einfacher Strategie/Idee an.
Seit dem Hoch im April 22 ist Coca Cola um ca. 18% gefallen, bis August gab es eine leichte Stabilisierung doch dann nahm der Verfall wieder deutlich zu.
Da ich schon immer gerne Coca Cola Aktien wollte, mir diese aber in der letzten Zeit zu teuer waren, kommt für mich jetzt ein sehr guter Zeitpunkt.
Ich mag die Dividendenrendite von Coca Cola und möchte gerne einige Aktien im Depot haben, da mir diese sehr solide erscheinen.
Wissen im Optionsgeschäft setzte ich jetzt voraus: Cash Secured Put
Ich habe heute zwei 52er Puts mit einer Laufzeit von 29 Tagen (04.11.22) geschrieben welche mir eine Prämie pro Put von jeweils 61$ eingebracht haben.
Fällt der Preis bis zum 04.11.22 unter 52$ bekomme ich diese Aktien in mein Depot gebucht. (1 Aktienkontrakt = 100 Aktien x 2 Puts = 200 Aktien = 10.400$)
Coca Cola zahlt im Jahr ca. 176$ Dividende (100 Aktien) + die Prämie von 61$ = 237$
Dividiert man es dann durch den Aktienkurs von 52$ erhalte ich für meine Investition auf das Jahr gesehen eine Rendite von 4,56% ohne die Berücksichtigung von Kursgewinnen und eventuellen Calls zur Einnahmengenerierung.
Bleibt der Kurs bis zum 04.11.22 über 52$ habe ich in 29 Tagen 122$ verdient, womit ich auch Leben kann.
Und je nach dem wie der Kurs am 04.11.22 steht, kann ich die Idee auch nochmal anwenden.
Ich hoffe ich konnte euch eine kleine nützliche Idee aus meinem täglichen Handeln vorstellen.

Die besten ETFs in CybersicherheitWer in Cybersicherheit anlegen möchte, kann auf einzelne Aktien wie Cloudflare ( NYSE:NET ), Cloudstrike ( NASDAQ:CRWD ) oder Norton ( NASDAQ:NLOK ) setzen. Wer breiter streuen möchte, setzt auf ETFs. Dabei hat der Global X Cybersecurity ETF ( NASDAQ:BUG ) im Vergleich zu seinen Pendants die Nase vorn. Da Privatanleger in Europa in US-amerikanische ETFs aufgrund besonderer Regelungen nicht direkt investieren können, hilft der Umweg über Optionen. Die ETFs BUG, CIBR und HACK ( AMEX:HACK ) sind dabei diejenigen, die das beste Optionshandelsvolumen aufweisen. Wer gerne Cash-Secured Puts handelt, ist auch hier mit dem ETF BUG am besten bedient, da dieser in einem niedrigerem Kurssegment notiert (aktuell um die 30$): Die Marginanforderung ist demnach geringer. Bleibt nur zu hoffen, dass bei der Umsetzung eines Trades auf BUG auf Ihrem PC, dessen Name für Sie nicht Programm wird...

Technisches Kaufsignal auf Medtronic Corp. (MDT)Die "Technicals" von TradingView haben auf die Aktie von Medtronic Corp . ein Kaufsignal ausgelöst. Die Aktie scheint bei 99$ eine erste Unterstützung aufzuweisen. Als Tradeidee könnte ein Cash-Secured Put mit Basispreis um die 100$ oder darunter einen Blick wert sein.
Disclaimer:
Diese Tradeidee dient lediglich zu Ausbildungszwecken und stellt weder eine Anlageberatung noch eine Aufforderung zum Kauf oder Verkauf von Wertpapieren oder Finanzinstrumenten dar. Investition in Wertpapiere und Finanzinstrumente ( vor allem Optionen) sind grundsätzlich mit Risiken, bis hin zum Totalverlust des eingesetzten Kapitals und darüber, verbunden. Jegliche Haftung wird von mir ausgeschlossen.

Technisches Kaufsignal auf Wheaton Precious Metals Corp. (WPM)Die "Technicals" von TradingView haben auf die Aktie von Wheaton Precious Metals Corp. ein Kaufsignal ausgelöst. Die Aktie scheint bei 38$ eine erste Unterstützung aufzuweisen. Als Tradeidee könnte ein Cash-Secured Put mit Basispreis 38$ oder darunter einen Blick wert sein.
Disclaimer:
Diese Tradeidee dient lediglich zu Ausbildungszwecken und stellt weder eine Anlageberatung noch eine Aufforderung zum Kauf oder Verkauf von Wertpapieren oder Finanzinstrumenten dar. Investition in Wertpapiere und Finanzinstrumente ( vor allem Optionen) sind grundsätzlich mit Risiken, bis hin zum Totalverlust des eingesetzten Kapitals und darüber, verbunden. Jegliche Haftung wird von mir ausgeschlossen.

Neuer Optionstrade auf QQQ - Nasdaq ETFDie aktuelle Schwäche in den Indizes könnte auf einen Verlauf unterhalb der gleitenden Durchschnitte hindeuten. Zudem ergeben sich durch den Anstieg der Volatilität gute Prämien.
Daher habe ich mich heute zu einem Trade auf #QQQ entschieden. Da ich gerne einen Sicherheitspuffer in den Trades habe und auch ein Seitwärtsverlauf möglich ist, habe ich einen Bear Call Spread gewählt.
Dieser besteht aus
einem verkauften Call am Strike 377 und
einem gekauften Call am Strike 382 jeweils mit Verfallstag 15.10.2021
Das Limit für die Kombination wurde zu -1,45 $ ausgeführt (Prämieneinnahme)
Unterhalb des Breakeven generiert dieser Trade einen Gewinn, das Rückkauflimit lege ich zu -0,30 $ in den Markt.
Beste Grüße und gute Trades,
Christian Möhrer - Kagels-Trading

UNG: Ist der Winter schon vorbei?UNG ist ein US-ETF auf Natural Gas. Vor ein paar Tagen habe ich bei Seekingalpha eine Analyse gelesen mit folgender Headline (frei übersetzt): "Wenn man sich den Chart von Natural Gas anschaut, könnte man denken, der Winter ist schon vorbei - ist er nicht!" Denn normalerweise sind im Winterhalbjahr bei Natural Gas immer schöne Aufwärtsbewegungen zu sehen. Aber wie man sehen kann - keine Regel ohne Ausnahme! UNG machte in den letzten Wochen ein Tief nach dem anderen. Trotzdem ist da diese Sache mit dem Winter...
Der Plan: Ins fallende Messer greifen und antizyklisch long gehen in UNG! Der Vorteil dabei ist, dass der STP recht eng gesetzt werden kann bei 16 USD. Ziele nach oben sind 17,60 und 18,70 sowie die 20 USD-Marke. Also ein schönes CRV.
Ich werde diesen Trade mit einem Strangle angehen. Dabei verkaufe ich zwei Optionen bei 15 USD und bei 19 USD und kassiere die Prämien. Bleibt der Kurs von UNG innerhalb dieser Spanne bis zum Verfall der Optionen, vereinnahme ich die Prämien komplett. Wer mag, kann auch direktional long gehen.

Strangle auf US SteelAm 4.12. habe ich einen Strangle auf X verkauft.
Der Put hat einen Strike bei 11 USD. Der Call hat einen Strike bei 16 USD.
Laufzeitende ist 17. Januar 2020.
Grund des Trades: X ist einer der wenigen Werte, bei dem die Vola ausreicht, um vernünftige Prämien zu bekommen.
Außerdem gehe ich davon aus, dass sich der Aktienkurs nach dem Anstieg von 10 USD erst einmal eine Pause gönnt und nicht aus der Range 11/ 16 USD ausbricht.

Optionstrading: Strangle auf Macy's!Gestern habe ich einen Strangle auf M eröffnet. Die Strikes liegen bei 13,50 USD beim Put und bei 17,50 USD beim Call.
Solange der Kurs bis zum Verfallsdatum am 24.1.2020 innerhalb dieser Range bleibt, ist der Trade ein Gewinner.
Ich konnte nicht ganz eine Delta-Neutralität hinbekommen. Dafür war die Volatilität in der Aktie ausreichend hoch für den Verkauf der beiden Optionen. Damit profitiere ich vom Zeitwertverfall der beiden Optionen, vor allem dann, wenn der Kurs sich in der Seitwärtsphase etabliert. Die sehr schmalen Bollinger Bänder zeigen das ganz gut.
Die Prämieneinnahme liegt bei 45 USD bei einem eingesetzten Kapital (Margin) von 250 USD.
Die nächsten Earnings bei Macy's werden am 20.2.2020 erwartet. Bis dahin sind von der Nachrichten-Front keine Störungen zu erwarten.

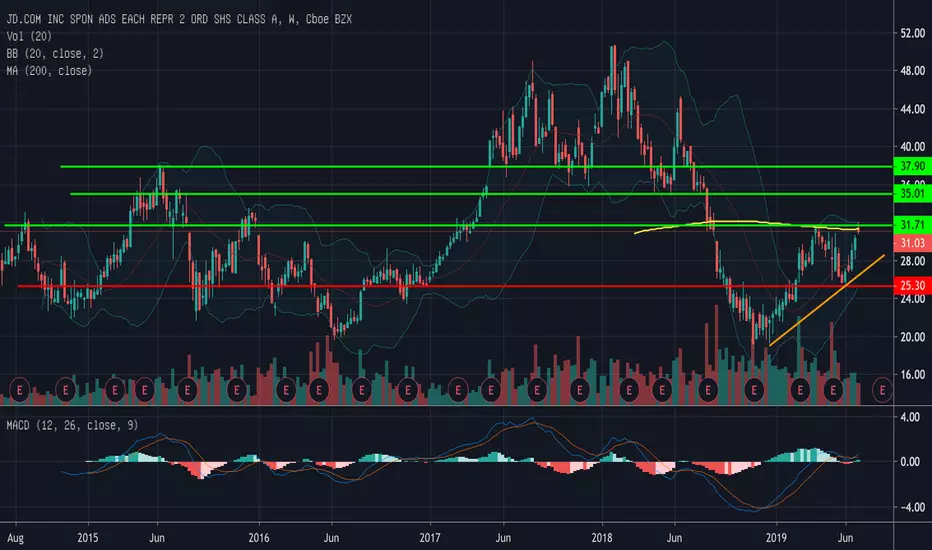
JD.com baut Druck auf!JD.com macht sich bereit zum großen Sprung. Ich habe mal das große Bild aufgemacht. Der 5-Jahreschart zeigt, dass die Aktie an einem interessanten Bereich notiert. Gelingt der Break der 30/31 USD, kann es bis zur 35 USD-Marke ganz fix gehen. Aufmerksam geworden auf die Aktie bin ich durch einen Artikel über das Open Interest bei den Call-Optionen. Eine große Anzahl Trader und Investoren haben ihre 31er Calls offenbar in den letzten Tagen zu den 35-er Calls hochgerollt (alles in USD). Das ist kein Freilos, aber es zeigt eine mögliche bullishe Tendenz. Außerdem können Trader bei der Aktie mit knappem Stopp agieren.