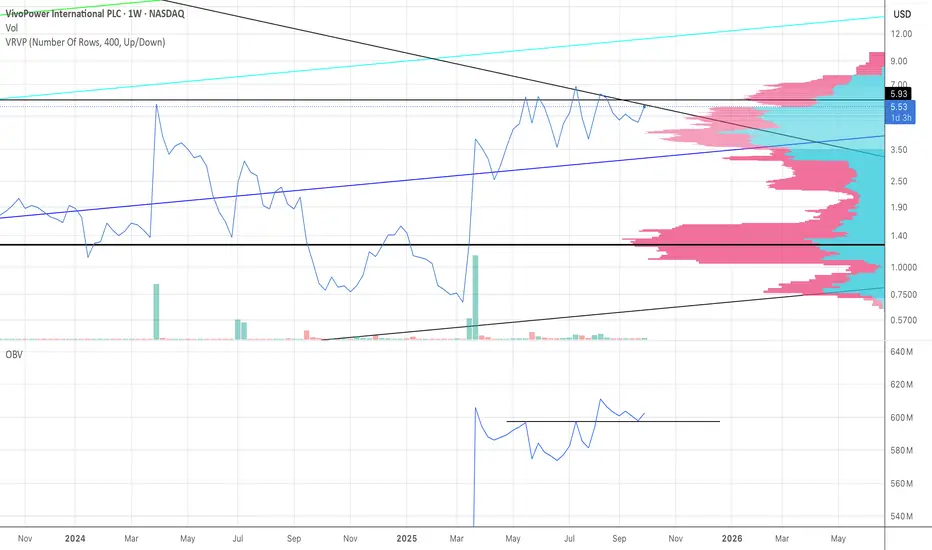
Here, we have the price (in line) smashing up against a descending overhead from early in the chart. Also, we're at the upper edges of the Volume Profile. Even though I don't have the whole chart history on the page, it doesn't matter because I have the part that has the volume, as you can see in that first green candle. That's when the chart "came to life". So, since volume has entered the ticker, we're at the upper edges of the price and the volume profile. A break out from here will be catastrophic for the bears, because the move will be larger than most anticipate.
Haftungsausschluss
Die Informationen und Veröffentlichungen sind nicht als Finanz-, Anlage-, Handels- oder andere Arten von Ratschlägen oder Empfehlungen gedacht, die von TradingView bereitgestellt oder gebilligt werden, und stellen diese nicht dar. Lesen Sie mehr in den Nutzungsbedingungen.
Haftungsausschluss
Die Informationen und Veröffentlichungen sind nicht als Finanz-, Anlage-, Handels- oder andere Arten von Ratschlägen oder Empfehlungen gedacht, die von TradingView bereitgestellt oder gebilligt werden, und stellen diese nicht dar. Lesen Sie mehr in den Nutzungsbedingungen.