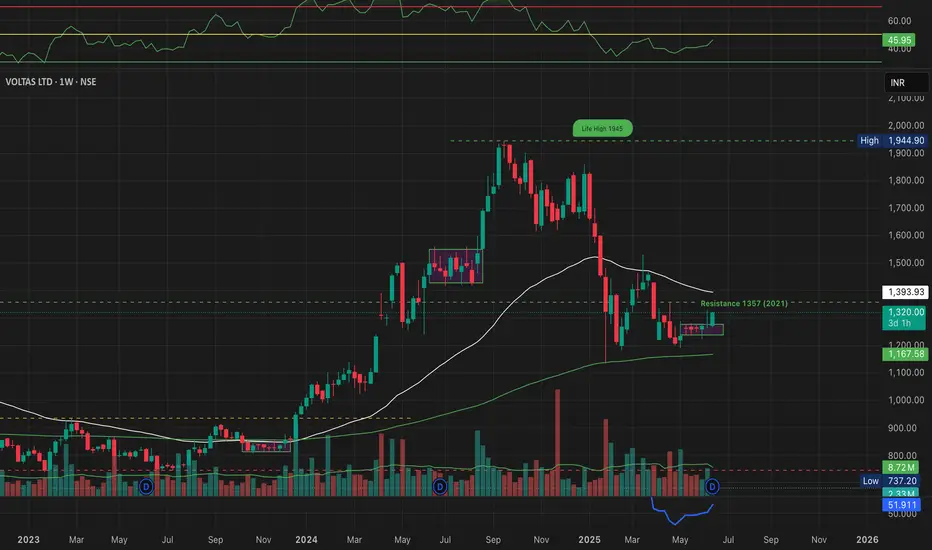
This weekly chart of Voltas Ltd (NSE: VOLTAS) suggests a potential recovery phase after a prolonged downtrend, with key technical levels being tested.
Key Technical Highlights:
• 🟩 Current Price: ₹1,319.90, noticeable volume spike.
• 📏 Resistance Ahead: ₹1,357 — a historic level from 2021, now acting as a critical resistance zone.
• 📉 Life High: ₹1,945 remains the long-term target in case of sustained uptrend.
• ⚙️ RSI Indicator: At 45.95, RSI is neutral but showing early signs of momentum.
• 🔄 Chart Pattern: Recent breakout from tight consolidation, along with increasing volume, could be an early sign of trend reversal.
Investors may watch closely how the price reacts near ₹1,357 — a breakout above could trigger a fresh bullish wave.
⸻
Analysis By Mayur Jayant Takalikar --For
LEARNING & OBSERVATIONAL USE ONLY.
⚠️ Disclaimer:
I am not a SEBI-registered investment advisor.
The analysis is purely for educational and informational purposes. This is not a buy/sell recommendation. Always consult with a certified financial advisor before making investment decisions. Stock market trading involves risks — do your own research.
Haftungsausschluss
Die Informationen und Veröffentlichungen sind nicht als Finanz-, Anlage-, Handels- oder andere Arten von Ratschlägen oder Empfehlungen gedacht, die von TradingView bereitgestellt oder gebilligt werden, und stellen diese nicht dar. Lesen Sie mehr in den Nutzungsbedingungen.
Haftungsausschluss
Die Informationen und Veröffentlichungen sind nicht als Finanz-, Anlage-, Handels- oder andere Arten von Ratschlägen oder Empfehlungen gedacht, die von TradingView bereitgestellt oder gebilligt werden, und stellen diese nicht dar. Lesen Sie mehr in den Nutzungsbedingungen.