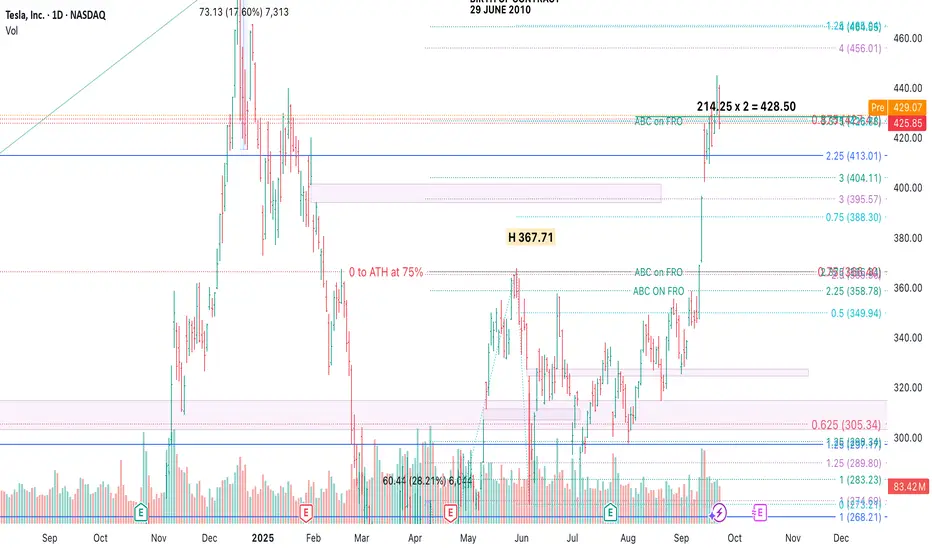
This chart highlights Tesla's price action through a potential ABC pattern, measured time cycles, and trend angles. The move from the April 2025 low to the recent September 2025 high spans 110 calendar days, mirroring a prior 110-day downswing — indicating possible time balance. Volume expansion supports the current uptrend, and we may be approaching a critical price/time resistance area. Watching for confirmation or reversal.
Haftungsausschluss
Die Informationen und Veröffentlichungen sind nicht als Finanz-, Anlage-, Handels- oder andere Arten von Ratschlägen oder Empfehlungen gedacht, die von TradingView bereitgestellt oder gebilligt werden, und stellen diese nicht dar. Lesen Sie mehr in den Nutzungsbedingungen.
Haftungsausschluss
Die Informationen und Veröffentlichungen sind nicht als Finanz-, Anlage-, Handels- oder andere Arten von Ratschlägen oder Empfehlungen gedacht, die von TradingView bereitgestellt oder gebilligt werden, und stellen diese nicht dar. Lesen Sie mehr in den Nutzungsbedingungen.