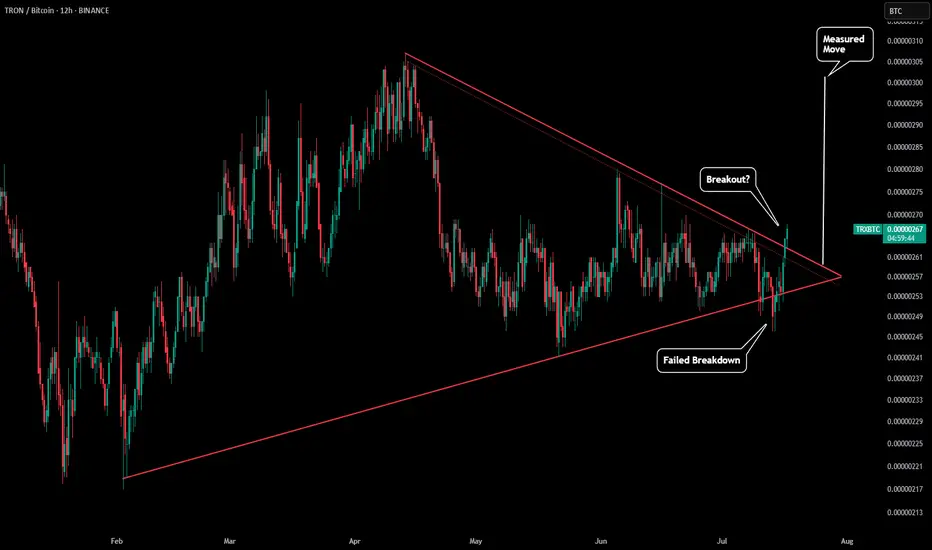
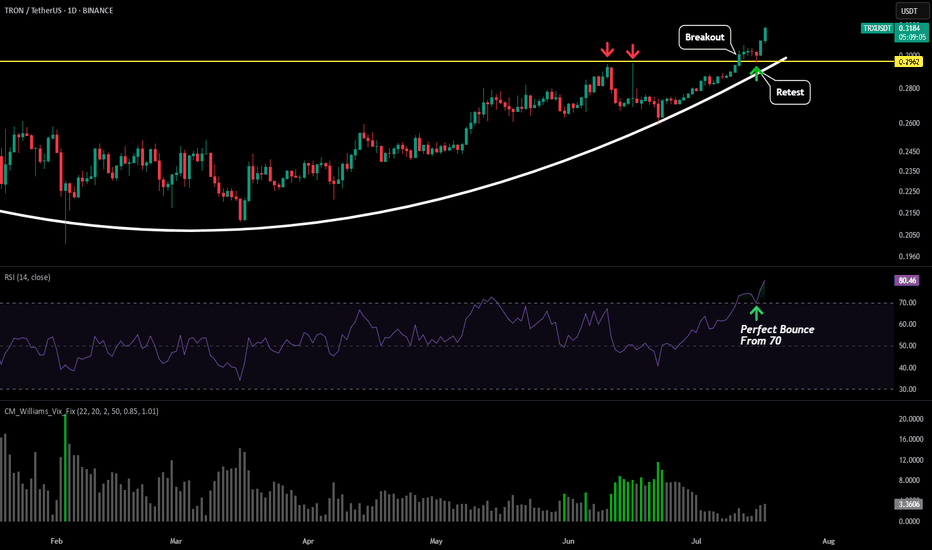
We have already seen the TRX/USD chart breakout (as seen in our previous post), but now the BTC pair is trying to breakout to.
On the daily chart we are trying to get above our downwards sloping red resistance line. It is possible we retest, but if this breakout continue that could push the BTC pair to above $0.000003 +. This is inline with our measured move (white line) and also where the symmetrical triangle started.
On the daily chart we are trying to get above our downwards sloping red resistance line. It is possible we retest, but if this breakout continue that could push the BTC pair to above $0.000003 +. This is inline with our measured move (white line) and also where the symmetrical triangle started.
Haftungsausschluss
Die Informationen und Veröffentlichungen sind nicht als Finanz-, Anlage-, Handels- oder andere Arten von Ratschlägen oder Empfehlungen gedacht, die von TradingView bereitgestellt oder gebilligt werden, und stellen diese nicht dar. Lesen Sie mehr in den Nutzungsbedingungen.
Haftungsausschluss
Die Informationen und Veröffentlichungen sind nicht als Finanz-, Anlage-, Handels- oder andere Arten von Ratschlägen oder Empfehlungen gedacht, die von TradingView bereitgestellt oder gebilligt werden, und stellen diese nicht dar. Lesen Sie mehr in den Nutzungsbedingungen.