How to Use It in Trading (Step-by-Step Simplified)
Method 1: Find Support/Resistance from a Major High or Low
suppose you stock price is 100
Take a significant high or low price (e.g.,TATASTEEL all-time high was ~ 187/-).
Find the closest number in the Square of 9 (or enter the price into a Gann Square of 9 calculator).
Move along the key angles to find the next levels.
Example (very simplified):
Suppose current price = 100
Square root of 100 ≈ 10 (10 X 10)
To find next major resistance at 180° (opposite side):
Add 2 → 12 → 12²(12 X 12) = 144 → so 144 is strong resistance
Add another 2 → 14²(14 X 14) = 196 → next big level
To find support below:
Subtract 2 → 8² (8 X 8) = 64 → strong support
Rule of thumb (the famous one every Gann student memorizes):
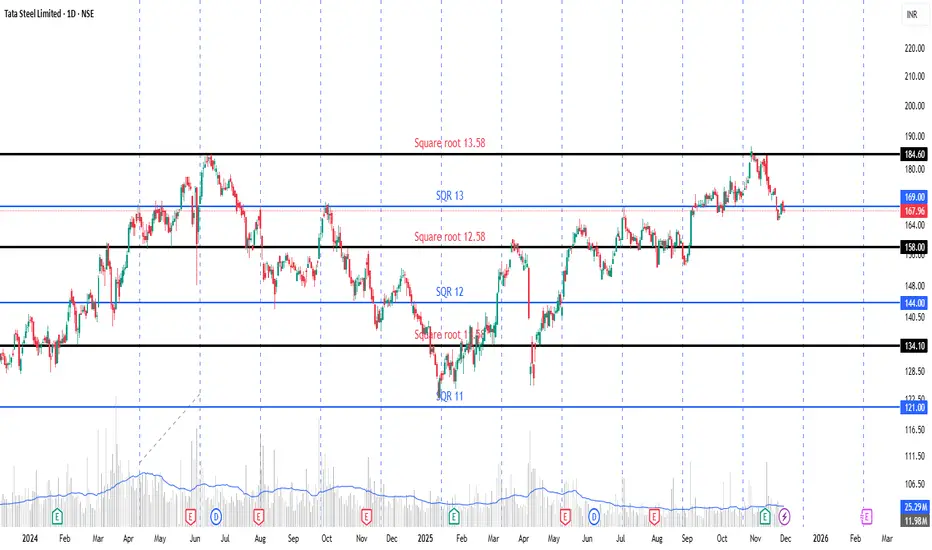
(TATASTEEL 2004–2025)
JUN 2024 HIGH ≈ 184.60 → √184.60 ≈ 13.58 → 13.58² = ~184.60
Less 1 (45°) → 12.58² = 158 → minor
Less another 1 → 11.58² = 134 ( last time act as support zone)
but remember round figure Square Root is impotent point. just watch
Square root (13-2) =11 - 11² = 122 price level work as a strong support on Dec,2024.
To go UP one full 90° → add 2 to the square root, then square it
To go UP one full 180° → add 4 to the square root, then square it
To go DOWN → subtract instead of add
Quick Cheat Sheet (Most Used Moves)
Move Formula Example (from 100) (What I call)
Next 45° up (√price + 1)² (10 + 1)² = 121 (Hurdle point)
Next 90° up (√price + 2)² (10 + 2)² = 144 ( Resistance point)
Next 180° up (√price + 4)² (10 + 4)² = 196 (New Breakout Point)
Next 360° up (√price + 8)² (10 + 8)² = 324 (Final Target)
Next 90° down (√price – 2)² (10 – 2)² = 64 (pure profit booking point)
These levels (64, 121, 144, 196, 324, etc.) very often act as support/resistance.
Method 2: Time & Price Squaring
Gann said when Time = Price (in square of 9 terms), the market reverses.
Example:
A low happened at price 25 (which is 5²)
49 days later = 7² → if price also reaches near a 7² level (49 area), high probability of reversal.
Method 1: Find Support/Resistance from a Major High or Low
suppose you stock price is 100
Take a significant high or low price (e.g.,TATASTEEL all-time high was ~ 187/-).
Find the closest number in the Square of 9 (or enter the price into a Gann Square of 9 calculator).
Move along the key angles to find the next levels.
Example (very simplified):
Suppose current price = 100
Square root of 100 ≈ 10 (10 X 10)
To find next major resistance at 180° (opposite side):
Add 2 → 12 → 12²(12 X 12) = 144 → so 144 is strong resistance
Add another 2 → 14²(14 X 14) = 196 → next big level
To find support below:
Subtract 2 → 8² (8 X 8) = 64 → strong support
Rule of thumb (the famous one every Gann student memorizes):
(TATASTEEL 2004–2025)
JUN 2024 HIGH ≈ 184.60 → √184.60 ≈ 13.58 → 13.58² = ~184.60
Less 1 (45°) → 12.58² = 158 → minor
Less another 1 → 11.58² = 134 ( last time act as support zone)
but remember round figure Square Root is impotent point. just watch
Square root (13-2) =11 - 11² = 122 price level work as a strong support on Dec,2024.
To go UP one full 90° → add 2 to the square root, then square it
To go UP one full 180° → add 4 to the square root, then square it
To go DOWN → subtract instead of add
Quick Cheat Sheet (Most Used Moves)
Move Formula Example (from 100) (What I call)
Next 45° up (√price + 1)² (10 + 1)² = 121 (Hurdle point)
Next 90° up (√price + 2)² (10 + 2)² = 144 ( Resistance point)
Next 180° up (√price + 4)² (10 + 4)² = 196 (New Breakout Point)
Next 360° up (√price + 8)² (10 + 8)² = 324 (Final Target)
Next 90° down (√price – 2)² (10 – 2)² = 64 (pure profit booking point)
These levels (64, 121, 144, 196, 324, etc.) very often act as support/resistance.
Method 2: Time & Price Squaring
Gann said when Time = Price (in square of 9 terms), the market reverses.
Example:
A low happened at price 25 (which is 5²)
49 days later = 7² → if price also reaches near a 7² level (49 area), high probability of reversal.
Haftungsausschluss
Die Informationen und Veröffentlichungen sind nicht als Finanz-, Anlage-, Handels- oder andere Arten von Ratschlägen oder Empfehlungen gedacht, die von TradingView bereitgestellt oder gebilligt werden, und stellen diese nicht dar. Lesen Sie mehr in den Nutzungsbedingungen.
Haftungsausschluss
Die Informationen und Veröffentlichungen sind nicht als Finanz-, Anlage-, Handels- oder andere Arten von Ratschlägen oder Empfehlungen gedacht, die von TradingView bereitgestellt oder gebilligt werden, und stellen diese nicht dar. Lesen Sie mehr in den Nutzungsbedingungen.