Based on the images you've uploaded, here's a detailed analysis and summary of the SWIGGY LTD chart:
---
### **Chart Pattern and Technical Overview:**
* **Falling Channel:**
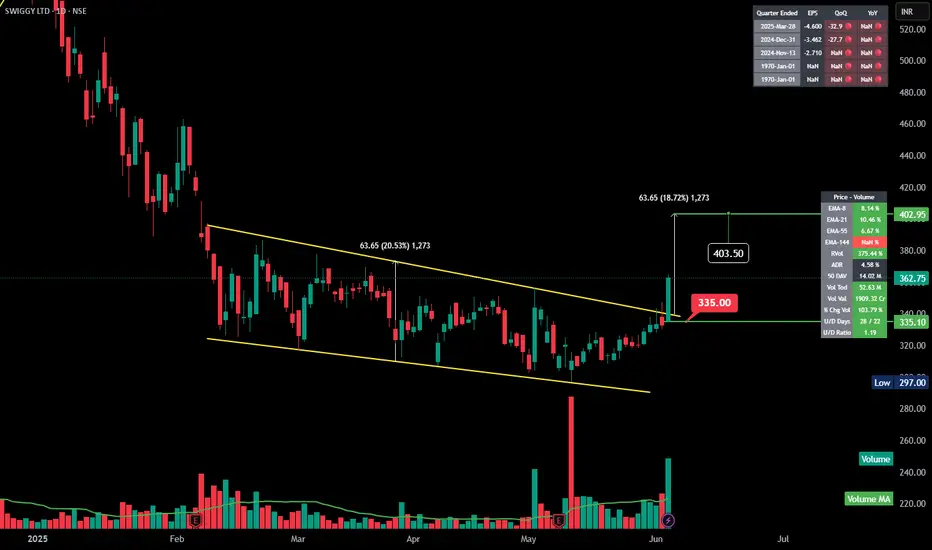
The price action was contained in a downward-sloping channel, marked by two yellow trendlines (upper and lower boundaries).
This pattern reflects a period of consolidation within a larger downtrend.
* **Breakout:**
Recently, the price has broken out of this descending channel, closing above the upper trendline around the 335.00 level.
Such a breakout is typically considered bullish, suggesting a potential trend reversal or at least a short-term move to the upside.
* **Volume Confirmation:**
A significant increase in volume accompanied the breakout, confirming the strength of this move.
High volume breakouts generally have a higher probability of sustaining.
* **Price Targets & Measurements:**
* The breakout target is projected based on the height of the channel (approx. 63.65 points).
* Measured breakout target:
$\text{Breakout level (335.00)} + \text{Channel height (63.65)} = 403.50$.
* Current price: 362.75.
* Immediate resistance zone near 403.50.
---
* **Volume:**
* Today’s volume (52.63M) is above the 50-day average (14.02M).
* This indicates strong interest and participation by traders.
---
### **Key Levels:**
✅ Support: **335.00**
✅ Resistance: **403.50**
✅ Low: **297.00**
---
### **Conclusion & Implication:**
The breakout from the falling channel with strong volume suggests a potential bullish continuation towards 403.50, as long as 335.00 holds as support. Watch for further volume spikes and price action near the target zone to determine sustainability.
---
---
### **Chart Pattern and Technical Overview:**
* **Falling Channel:**
The price action was contained in a downward-sloping channel, marked by two yellow trendlines (upper and lower boundaries).
This pattern reflects a period of consolidation within a larger downtrend.
* **Breakout:**
Recently, the price has broken out of this descending channel, closing above the upper trendline around the 335.00 level.
Such a breakout is typically considered bullish, suggesting a potential trend reversal or at least a short-term move to the upside.
* **Volume Confirmation:**
A significant increase in volume accompanied the breakout, confirming the strength of this move.
High volume breakouts generally have a higher probability of sustaining.
* **Price Targets & Measurements:**
* The breakout target is projected based on the height of the channel (approx. 63.65 points).
* Measured breakout target:
$\text{Breakout level (335.00)} + \text{Channel height (63.65)} = 403.50$.
* Current price: 362.75.
* Immediate resistance zone near 403.50.
---
* **Volume:**
* Today’s volume (52.63M) is above the 50-day average (14.02M).
* This indicates strong interest and participation by traders.
---
### **Key Levels:**
✅ Support: **335.00**
✅ Resistance: **403.50**
✅ Low: **297.00**
---
### **Conclusion & Implication:**
The breakout from the falling channel with strong volume suggests a potential bullish continuation towards 403.50, as long as 335.00 holds as support. Watch for further volume spikes and price action near the target zone to determine sustainability.
---
Haftungsausschluss
Die Informationen und Veröffentlichungen sind nicht als Finanz-, Anlage-, Handels- oder andere Arten von Ratschlägen oder Empfehlungen gedacht, die von TradingView bereitgestellt oder gebilligt werden, und stellen diese nicht dar. Lesen Sie mehr in den Nutzungsbedingungen.
Haftungsausschluss
Die Informationen und Veröffentlichungen sind nicht als Finanz-, Anlage-, Handels- oder andere Arten von Ratschlägen oder Empfehlungen gedacht, die von TradingView bereitgestellt oder gebilligt werden, und stellen diese nicht dar. Lesen Sie mehr in den Nutzungsbedingungen.