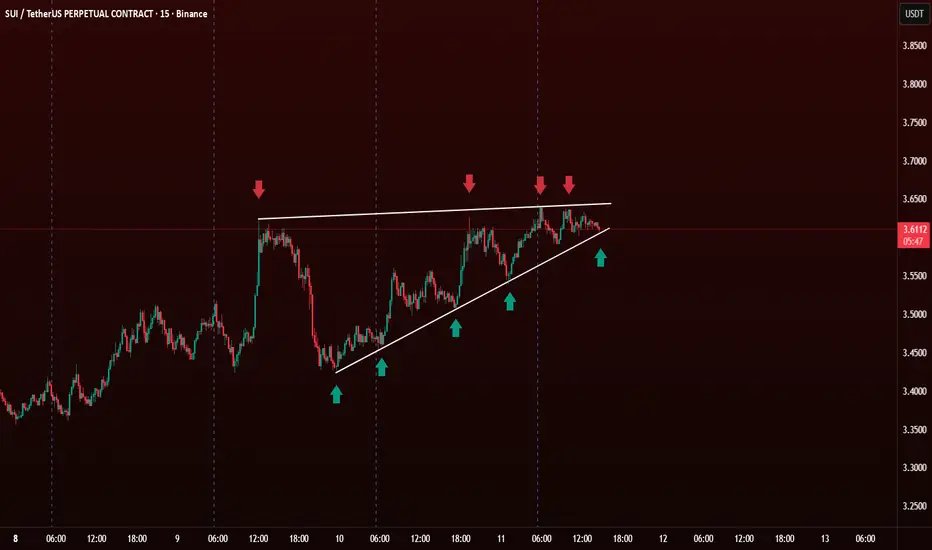
The Ascending Triangle is a bullish continuation pattern. It forms when the price creates higher lows (🔼) while facing consistent resistance at the same horizontal level (🔴).
🧐 How to Identify It
📊 How to Trade It

 SUIUSDT.P
🧐 How to Identify It
- Flat Resistance Line 🔴
- Price hits the same level multiple times and gets rejected.
- This creates a horizontal line on top.
- Rising Support Trendline 🔼
Each dip forms a higher low, indicating buying pressure.
Connect the swing lows with a rising trendline 📈.
📊 How to Trade It
Entry : Breakout Entry: Enter when price breaks and closes above the resistance line with high volume 💥.Conservative traders wait for a retest of the breakout zone (resistance becomes support).
Target : Measure the height of the triangle and project it upward from the breakout point.
Example: If triangle height = $0.30, add $0.30 above breakout.
Stop Loss : Below the last higher low 🔽 Or slightly below the triangle support trendline 📉
Haftungsausschluss
Die Informationen und Veröffentlichungen sind nicht als Finanz-, Anlage-, Handels- oder andere Arten von Ratschlägen oder Empfehlungen gedacht, die von TradingView bereitgestellt oder gebilligt werden, und stellen diese nicht dar. Lesen Sie mehr in den Nutzungsbedingungen.
Haftungsausschluss
Die Informationen und Veröffentlichungen sind nicht als Finanz-, Anlage-, Handels- oder andere Arten von Ratschlägen oder Empfehlungen gedacht, die von TradingView bereitgestellt oder gebilligt werden, und stellen diese nicht dar. Lesen Sie mehr in den Nutzungsbedingungen.