📌 SOL 2D Chart shows a head & shoulder pattern✅
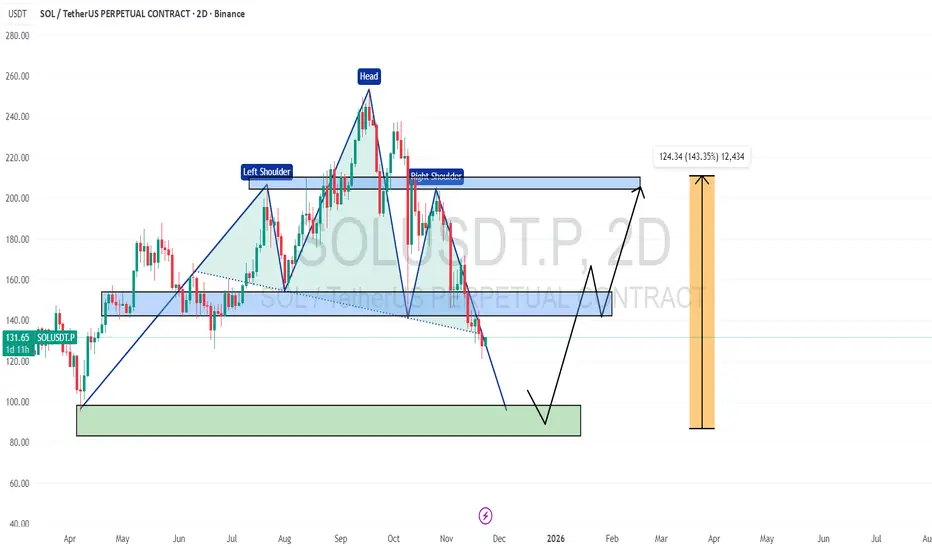
📌 If this continues, the price may continue to decline ✅
📌 However, a bullish reversal is expected from the support zone below ✅
If this happens, the price may go back to the $150, $200+ range 🔥🚀
📌 If this continues, the price may continue to decline ✅
📌 However, a bullish reversal is expected from the support zone below ✅
If this happens, the price may go back to the $150, $200+ range 🔥🚀
Join My Free Signal Channel ➡ t.me/Leo524
Haftungsausschluss
Die Informationen und Veröffentlichungen sind nicht als Finanz-, Anlage-, Handels- oder andere Arten von Ratschlägen oder Empfehlungen gedacht, die von TradingView bereitgestellt oder gebilligt werden, und stellen diese nicht dar. Lesen Sie mehr in den Nutzungsbedingungen.