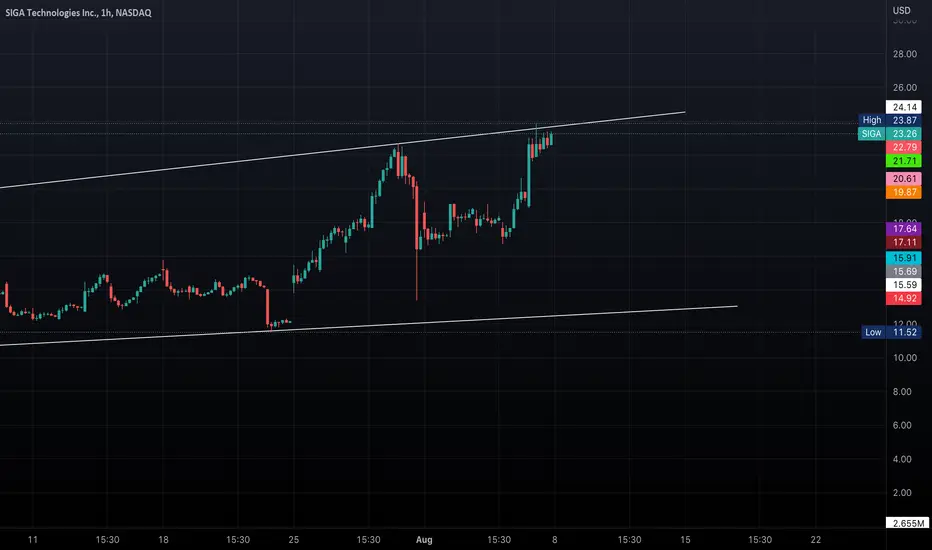
SIGA has an ascending channel pattern on the daily chart.
A closer look at SIGA shows a bull flag formation on the hourly chart.
I strongly believe that a break of the flag (on the hourly) will push SIGA above the upper trendline of the ascending channel (on the daily).
The measured potential maximum move of the bull flag is approximately 4.18 points and the measured potential maximum move of the ascending channel is approximately 15.90 points. Therefore, the combined potential maximum move approximation is 20.08 points.
Therefore, my entry will occur after price breaks and holds level 24.


*This is not financial advice.
Loved and Blessed,
MrALTrades00
A closer look at SIGA shows a bull flag formation on the hourly chart.
I strongly believe that a break of the flag (on the hourly) will push SIGA above the upper trendline of the ascending channel (on the daily).
The measured potential maximum move of the bull flag is approximately 4.18 points and the measured potential maximum move of the ascending channel is approximately 15.90 points. Therefore, the combined potential maximum move approximation is 20.08 points.
Therefore, my entry will occur after price breaks and holds level 24.
*This is not financial advice.
Loved and Blessed,
MrALTrades00
Haftungsausschluss
Die Informationen und Veröffentlichungen sind nicht als Finanz-, Anlage-, Handels- oder andere Arten von Ratschlägen oder Empfehlungen gedacht, die von TradingView bereitgestellt oder gebilligt werden, und stellen diese nicht dar. Lesen Sie mehr in den Nutzungsbedingungen.
Haftungsausschluss
Die Informationen und Veröffentlichungen sind nicht als Finanz-, Anlage-, Handels- oder andere Arten von Ratschlägen oder Empfehlungen gedacht, die von TradingView bereitgestellt oder gebilligt werden, und stellen diese nicht dar. Lesen Sie mehr in den Nutzungsbedingungen.