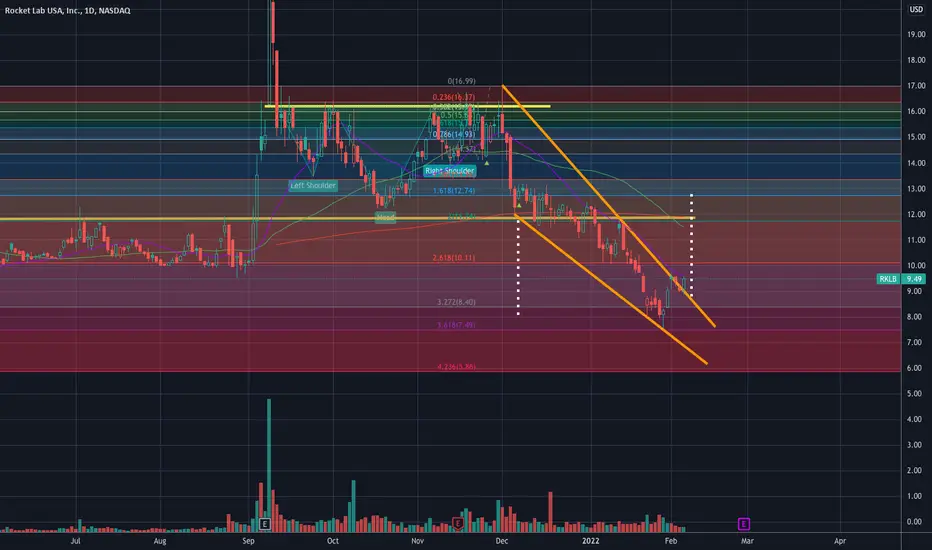
RKLB broke down from the rectangle and paid the measured move in full. It has formed the descending wedge pattern with the price about to break out of the upper trend line area.
The breakout is confirmed if the price breaks above $10.20 area with maximum near term reach of $12.74 area.
If the momentum allows, the price could travel further up to $14.37 area.
If the breakout fails, the price could travel back to $8.40 and $7.50 area and could form a double bottom.
Target 1 - $12.74
Target 2 - $14.37
Target 3 -$16.37
Risk - failure to break above $10.20 and fall back to $8.40 to $7.50.
———————————————————
How to read my charts?
- Matching color trend lines shows the pattern. Sometimes a chart can have multiple patterns. Each pattern will have matching color trend lines.
- The yellow horizontal lines show support and resistance areas.
- Fib lines also show support and resistance areas.
- The dotted white lines show the price projection for breakout or breakdown target.
Disclaimer: Do your own DD. Not investment advice.
I am not a licensed professional. None of the posts that I published are investment advice. Do your own research.
Haftungsausschluss
Die Informationen und Veröffentlichungen sind nicht als Finanz-, Anlage-, Handels- oder andere Arten von Ratschlägen oder Empfehlungen gedacht, die von TradingView bereitgestellt oder gebilligt werden, und stellen diese nicht dar. Lesen Sie mehr in den Nutzungsbedingungen.