Short
RDUS Stochastic Oscillator left the overbought zone on June 29
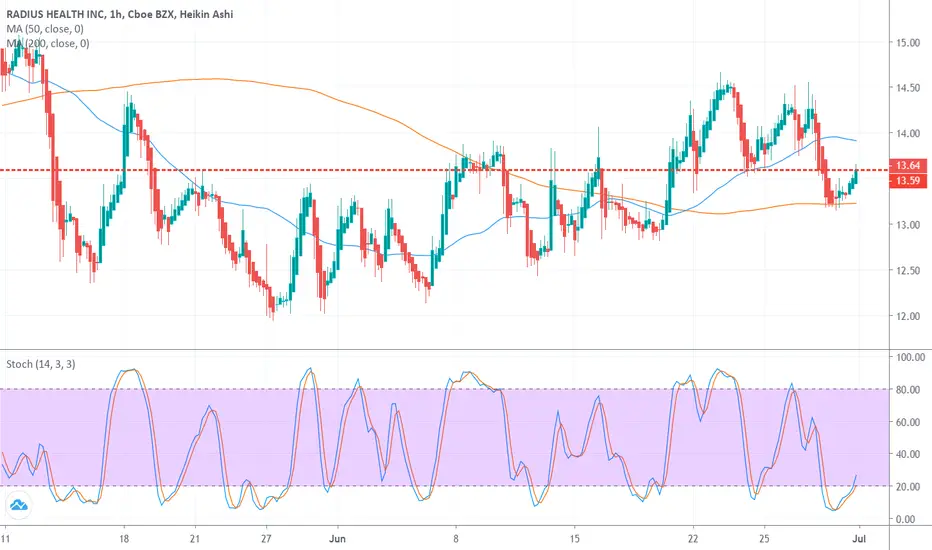
Tickeron AI shows that this is a signal that RDUS's price trend could be reversing, and it may be an opportunity to sell the stock or take a defensive position. Tickeron A.I.dvisor identified 62 similar cases where RDUS's stochastic oscillator exited the overbought zone, and 56 of them led to successful outcomes. Odds of Success: 90%.
The price moved below its 50-day Moving Average, which indicates a reversal from an Uptrend to a Downtrend. In 42 of 52 cases where RDUS's price crossed below its 50-day Moving Average, its price fell further within the subsequent month. The odds of a continued Downtrend are 81%.
The price moved below its 50-day Moving Average, which indicates a reversal from an Uptrend to a Downtrend. In 42 of 52 cases where RDUS's price crossed below its 50-day Moving Average, its price fell further within the subsequent month. The odds of a continued Downtrend are 81%.
Haftungsausschluss
Die Informationen und Veröffentlichungen sind nicht als Finanz-, Anlage-, Handels- oder andere Arten von Ratschlägen oder Empfehlungen gedacht, die von TradingView bereitgestellt oder gebilligt werden, und stellen diese nicht dar. Lesen Sie mehr in den Nutzungsbedingungen.
Haftungsausschluss
Die Informationen und Veröffentlichungen sind nicht als Finanz-, Anlage-, Handels- oder andere Arten von Ratschlägen oder Empfehlungen gedacht, die von TradingView bereitgestellt oder gebilligt werden, und stellen diese nicht dar. Lesen Sie mehr in den Nutzungsbedingungen.