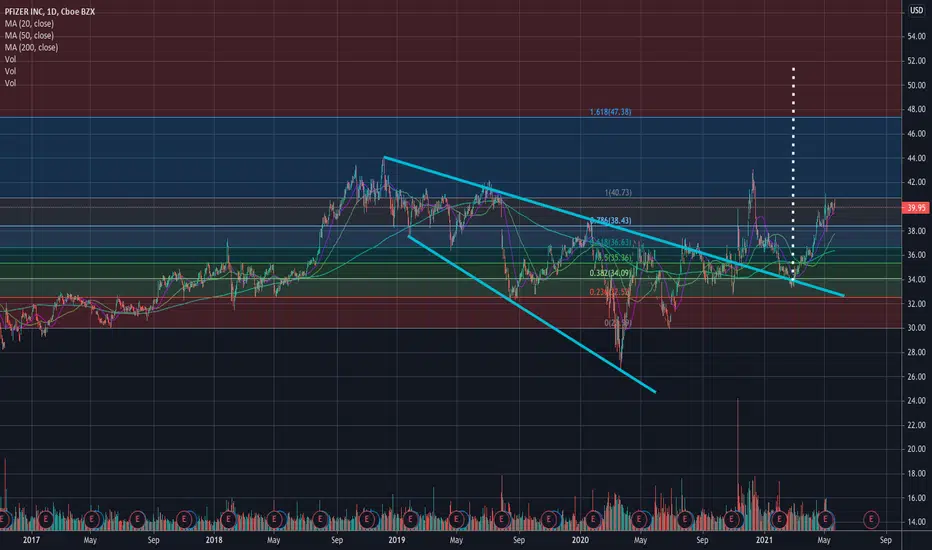
PFE is fighting to get pass the fib extension resistance. The next fib 1.618 is $47.38.
If we get over current fib resistance we could see $47.38.
———————————————————
How to read my charts?
- Matching color trend lines shows the pattern. Sometimes a chart can have multiple patterns. Each pattern will have matching color trend lines.
- The yellow horizontal lines shows support and resistance areas.
- Fib lines also shows support and resistance areas.
- The dotted white lines shows price projection for breakout or breakdown target.
Disclaimer: Do your own DD. Not an investment advice.
I am not a licensed professional. None of the posts that I published are investment advice. Do your own research.
Haftungsausschluss
Die Informationen und Veröffentlichungen sind nicht als Finanz-, Anlage-, Handels- oder andere Arten von Ratschlägen oder Empfehlungen gedacht, die von TradingView bereitgestellt oder gebilligt werden, und stellen diese nicht dar. Lesen Sie mehr in den Nutzungsbedingungen.