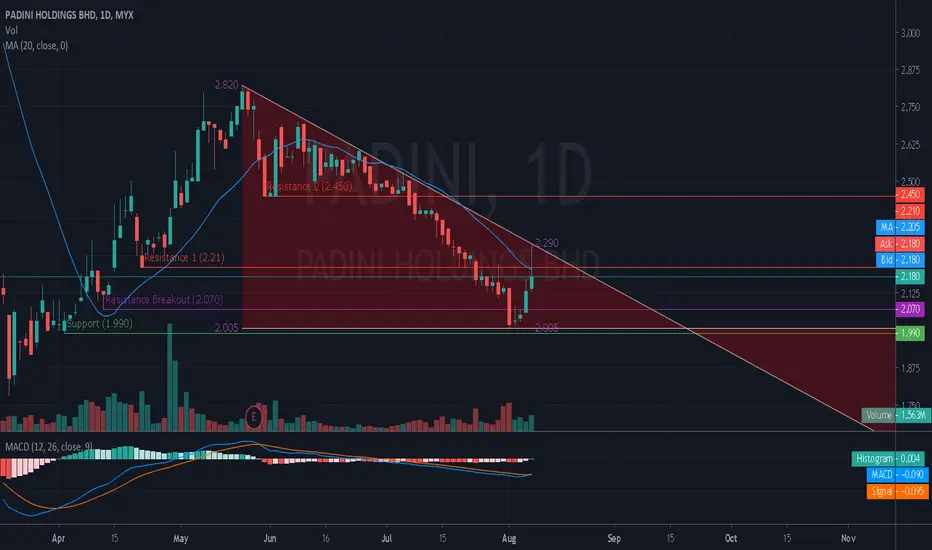
Technically, it is not looking good for PADINI as its 20-Day Moving Average is sloping downward and its price action is below the Moving Average line.
Furthermore the support level is still quite far at 2.01.
Descending Triangle identified at 3 Aug 20.
This pattern is still in the process of forming.
Possible bearish price movement towards the support within next 49 days (ETA 21 Sep 20)
Resistance 1 : 2.45
Resistance 2 : 2.21
Support : 1.990
Resistance Breakout : 2.070 (13 Apr 2020)
Trade ist aktiv
Trade ist aktiv
Haftungsausschluss
Die Informationen und Veröffentlichungen sind nicht als Finanz-, Anlage-, Handels- oder andere Arten von Ratschlägen oder Empfehlungen gedacht, die von TradingView bereitgestellt oder gebilligt werden, und stellen diese nicht dar. Lesen Sie mehr in den Nutzungsbedingungen.
Haftungsausschluss
Die Informationen und Veröffentlichungen sind nicht als Finanz-, Anlage-, Handels- oder andere Arten von Ratschlägen oder Empfehlungen gedacht, die von TradingView bereitgestellt oder gebilligt werden, und stellen diese nicht dar. Lesen Sie mehr in den Nutzungsbedingungen.