//version=4
study("HalfTrend", overlay=true)
amplitude = input(title="Amplitude", defval=1)
channelDeviation = input(title="Channel Deviation", defval=2)
showArrows = input(title="Show Arrows", defval=true)
showChannels = input(title="Show Channels", defval=false)
var int trend = 0
var int nextTrend = 0
var float maxLowPrice = nz(low[1], low)
var float minHighPrice = nz(high[1], high)
var float up = 0.0
var float down = 0.0
float atrHigh = 0.0
float atrLow = 0.0
float arrowUp = na
float arrowDown = na
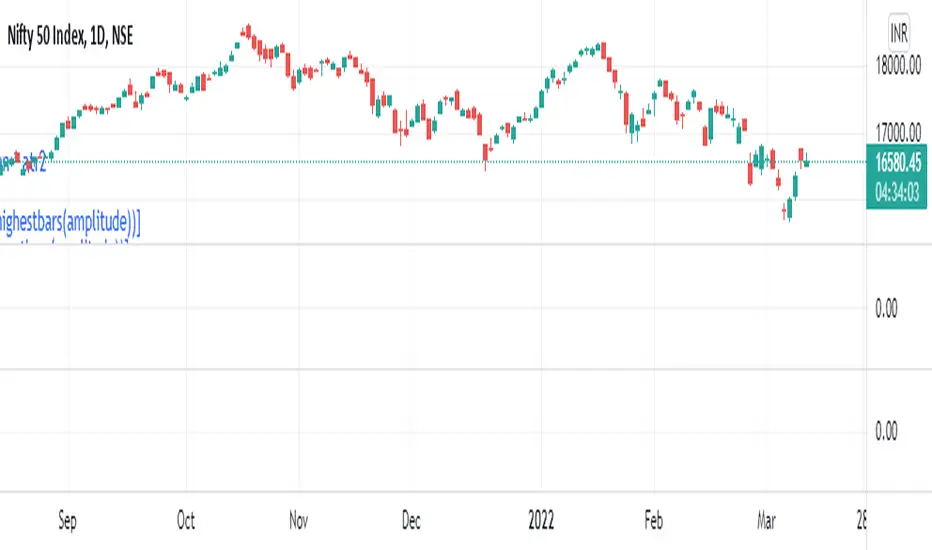
atr2 = atr(100) / 2
dev = channelDeviation * atr2
highPrice = high[abs(highestbars(amplitude))]
lowPrice = low[abs(lowestbars(amplitude))]
highma = sma(high, amplitude)
lowma = sma(low, amplitude)
if nextTrend == 1
maxLowPrice := max(lowPrice, maxLowPrice)
if highma < maxLowPrice and close < nz(low[1], low)
trend := 1
nextTrend := 0
minHighPrice := highPrice
else
minHighPrice := min(highPrice, minHighPrice)
if lowma > minHighPrice and close > nz(high[1], high)
trend := 0
nextTrend := 1
maxLowPrice := lowPrice
if trend == 0
if not na(trend[1]) and trend[1] != 0
up := na(down[1]) ? down : down[1]
arrowUp := up - atr2
else
up := na(up[1]) ? maxLowPrice : max(maxLowPrice, up[1])
atrHigh := up + dev
atrLow := up - dev
else
if not na(trend[1]) and trend[1] != 1
down := na(up[1]) ? up : up[1]
arrowDown := down + atr2
else
down := na(down[1]) ? minHighPrice : min(minHighPrice, down[1])
atrHigh := down + dev
atrLow := down - dev
ht = trend == 0 ? up : down
var color buyColor = color.blue
var color sellColor = color.red
htColor = trend == 0 ? buyColor : sellColor
htPlot = plot(ht, title="HalfTrend", linewidth=2, color=htColor)
atrHighPlot = plot(showChannels ? atrHigh : na, title="ATR High", style=plot.style_circles, color=sellColor)
atrLowPlot = plot(showChannels ? atrLow : na, title="ATR Low", style=plot.style_circles, color=buyColor)
fill(htPlot, atrHighPlot, title="ATR High Ribbon", color=sellColor)
fill(htPlot, atrLowPlot, title="ATR Low Ribbon", color=buyColor)
buySignal = not na(arrowUp) and (trend == 0 and trend[1] == 1)
sellSignal = not na(arrowDown) and (trend == 1 and trend[1] == 0)
plotshape(showArrows and buySignal ? atrLow : na, title="Arrow Up", style=shape.labelup, location=location.absolute, size=size.tiny, color=color.lime, textcolor=color.white, text="Buy")
plotshape(showArrows and sellSignal ? atrHigh : na, title="Arrow Down", style=shape.labeldown, location=location.absolute, size=size.tiny, color=sellColor, textcolor=color.white, text="Sell")
alertcondition(buySignal, title="Alert: HalfTrend Buy", message="HalfTrend Buy")
alertcondition(sellSignal, title="Alert: HalfTrend Sell", message="HalfTrend Sell")
study("HalfTrend", overlay=true)
amplitude = input(title="Amplitude", defval=1)
channelDeviation = input(title="Channel Deviation", defval=2)
showArrows = input(title="Show Arrows", defval=true)
showChannels = input(title="Show Channels", defval=false)
var int trend = 0
var int nextTrend = 0
var float maxLowPrice = nz(low[1], low)
var float minHighPrice = nz(high[1], high)
var float up = 0.0
var float down = 0.0
float atrHigh = 0.0
float atrLow = 0.0
float arrowUp = na
float arrowDown = na
atr2 = atr(100) / 2
dev = channelDeviation * atr2
highPrice = high[abs(highestbars(amplitude))]
lowPrice = low[abs(lowestbars(amplitude))]
highma = sma(high, amplitude)
lowma = sma(low, amplitude)
if nextTrend == 1
maxLowPrice := max(lowPrice, maxLowPrice)
if highma < maxLowPrice and close < nz(low[1], low)
trend := 1
nextTrend := 0
minHighPrice := highPrice
else
minHighPrice := min(highPrice, minHighPrice)
if lowma > minHighPrice and close > nz(high[1], high)
trend := 0
nextTrend := 1
maxLowPrice := lowPrice
if trend == 0
if not na(trend[1]) and trend[1] != 0
up := na(down[1]) ? down : down[1]
arrowUp := up - atr2
else
up := na(up[1]) ? maxLowPrice : max(maxLowPrice, up[1])
atrHigh := up + dev
atrLow := up - dev
else
if not na(trend[1]) and trend[1] != 1
down := na(up[1]) ? up : up[1]
arrowDown := down + atr2
else
down := na(down[1]) ? minHighPrice : min(minHighPrice, down[1])
atrHigh := down + dev
atrLow := down - dev
ht = trend == 0 ? up : down
var color buyColor = color.blue
var color sellColor = color.red
htColor = trend == 0 ? buyColor : sellColor
htPlot = plot(ht, title="HalfTrend", linewidth=2, color=htColor)
atrHighPlot = plot(showChannels ? atrHigh : na, title="ATR High", style=plot.style_circles, color=sellColor)
atrLowPlot = plot(showChannels ? atrLow : na, title="ATR Low", style=plot.style_circles, color=buyColor)
fill(htPlot, atrHighPlot, title="ATR High Ribbon", color=sellColor)
fill(htPlot, atrLowPlot, title="ATR Low Ribbon", color=buyColor)
buySignal = not na(arrowUp) and (trend == 0 and trend[1] == 1)
sellSignal = not na(arrowDown) and (trend == 1 and trend[1] == 0)
plotshape(showArrows and buySignal ? atrLow : na, title="Arrow Up", style=shape.labelup, location=location.absolute, size=size.tiny, color=color.lime, textcolor=color.white, text="Buy")
plotshape(showArrows and sellSignal ? atrHigh : na, title="Arrow Down", style=shape.labeldown, location=location.absolute, size=size.tiny, color=sellColor, textcolor=color.white, text="Sell")
alertcondition(buySignal, title="Alert: HalfTrend Buy", message="HalfTrend Buy")
alertcondition(sellSignal, title="Alert: HalfTrend Sell", message="HalfTrend Sell")
Haftungsausschluss
Die Informationen und Veröffentlichungen sind nicht als Finanz-, Anlage-, Handels- oder andere Arten von Ratschlägen oder Empfehlungen gedacht, die von TradingView bereitgestellt oder gebilligt werden, und stellen diese nicht dar. Lesen Sie mehr in den Nutzungsbedingungen.
Haftungsausschluss
Die Informationen und Veröffentlichungen sind nicht als Finanz-, Anlage-, Handels- oder andere Arten von Ratschlägen oder Empfehlungen gedacht, die von TradingView bereitgestellt oder gebilligt werden, und stellen diese nicht dar. Lesen Sie mehr in den Nutzungsbedingungen.