stock selection is crucial for swing trading as it determines the potential for capturing short- to medium-term price movements. For effective swing trading stock selection, focus on these key factors:
Liquidity: Choose stocks with high trading volume to ensure easy entry and exit.
Volatility: Stocks with moderate to high volatility (e.g., ATR > 2-3% of stock price) offer better price swings for profit potential.
Trend/Momentum: Identify stocks in a clear uptrend or downtrend using technical indicators like Moving Averages (5-day/20-day), RSI 50-60, or MACD. Stocks breaking out of consolidation patterns (e.g., triangles, flags) are ideal.
Catalysts: Look for stocks with upcoming events like earnings reports, product launches, or sector news that can drive price movement.
Sector Strength: Select stocks in strong sectors (e.g., tech, healthcare) using relative strength analysis or sector ETFs to confirm momentum.
Chart Patterns: Focus on stocks showing recognizable patterns like breakouts, pullbacks, or reversals on daily/weekly charts.
But you can Master in one Strategy for your trading setup
Master in One strategy :
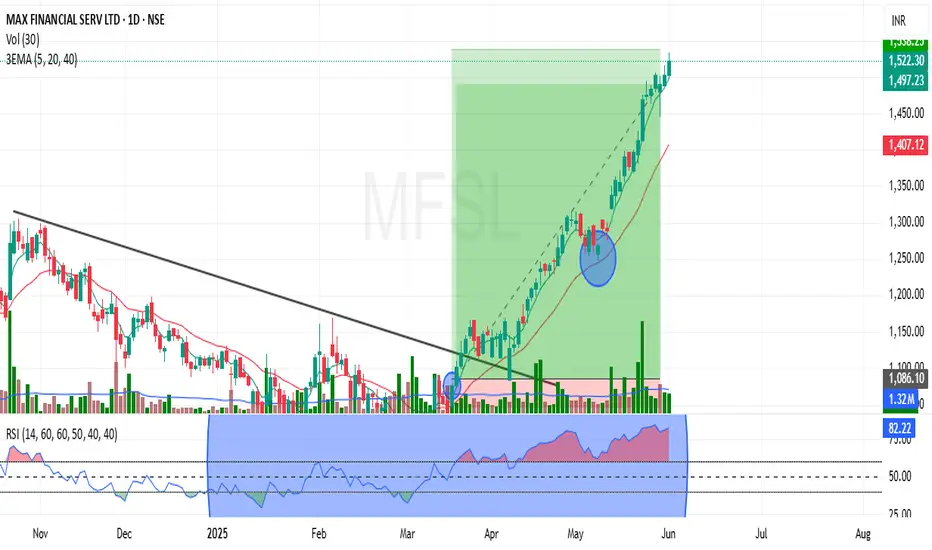
After a long period of decline, when the stock candle crosses the 5EMA, this time, the RSI is above 50, and the momentum starts when it hits the 20-day Exponential moving average, which at that time has the RSI at 60 or above 60. This is a normal process in every stock (your Enter Point & same candle low is your stop lose) . You just check and confirm if I am wrong. And after this event, a good bounce is seen in that stock. And often this move is of a minimum of 10 to 15 percent. You will be surprised to know that this phenomenon is seen more than three times in stocks
Liquidity: Choose stocks with high trading volume to ensure easy entry and exit.
Volatility: Stocks with moderate to high volatility (e.g., ATR > 2-3% of stock price) offer better price swings for profit potential.
Trend/Momentum: Identify stocks in a clear uptrend or downtrend using technical indicators like Moving Averages (5-day/20-day), RSI 50-60, or MACD. Stocks breaking out of consolidation patterns (e.g., triangles, flags) are ideal.
Catalysts: Look for stocks with upcoming events like earnings reports, product launches, or sector news that can drive price movement.
Sector Strength: Select stocks in strong sectors (e.g., tech, healthcare) using relative strength analysis or sector ETFs to confirm momentum.
Chart Patterns: Focus on stocks showing recognizable patterns like breakouts, pullbacks, or reversals on daily/weekly charts.
But you can Master in one Strategy for your trading setup
Master in One strategy :
After a long period of decline, when the stock candle crosses the 5EMA, this time, the RSI is above 50, and the momentum starts when it hits the 20-day Exponential moving average, which at that time has the RSI at 60 or above 60. This is a normal process in every stock (your Enter Point & same candle low is your stop lose) . You just check and confirm if I am wrong. And after this event, a good bounce is seen in that stock. And often this move is of a minimum of 10 to 15 percent. You will be surprised to know that this phenomenon is seen more than three times in stocks
Haftungsausschluss
Die Informationen und Veröffentlichungen sind nicht als Finanz-, Anlage-, Handels- oder andere Arten von Ratschlägen oder Empfehlungen gedacht, die von TradingView bereitgestellt oder gebilligt werden, und stellen diese nicht dar. Lesen Sie mehr in den Nutzungsbedingungen.
Haftungsausschluss
Die Informationen und Veröffentlichungen sind nicht als Finanz-, Anlage-, Handels- oder andere Arten von Ratschlägen oder Empfehlungen gedacht, die von TradingView bereitgestellt oder gebilligt werden, und stellen diese nicht dar. Lesen Sie mehr in den Nutzungsbedingungen.