Technical Analysis of KSE 100 Index (15-minute timeframe) 07-10-2025
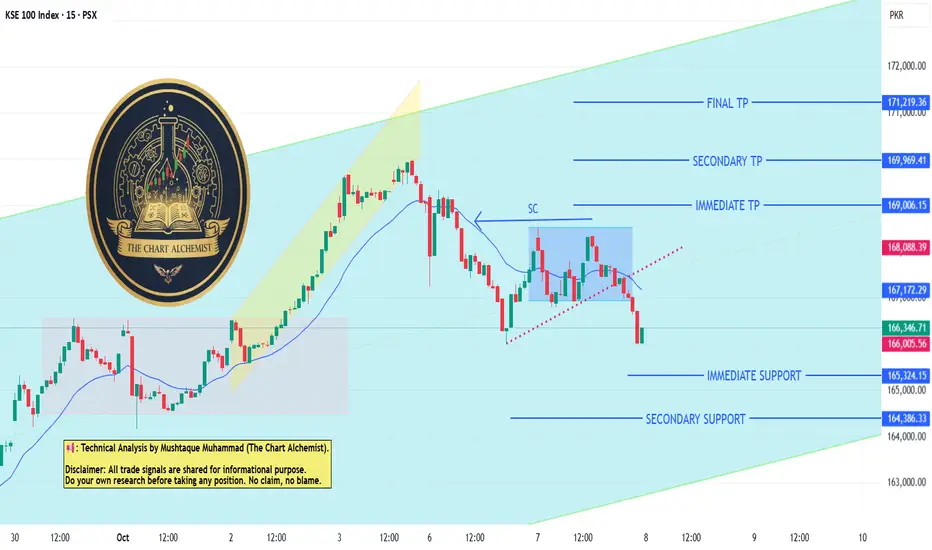
Contrary to our previous analysis, the index didn't achieve the given targets. Instead, it formed a DT Bear Flag pattern and broke down below it (marked with a red dotted line). We expect the index to continue moving lower, targeting immediate and secondary support levels at:
- 165,300
- 164,400
The index is expected to touch the bottom of the HTF (Higher Time Frame) channel before making another attempt to reverse and achieve the previously given targets.
Haftungsausschluss
Die Informationen und Veröffentlichungen sind nicht als Finanz-, Anlage-, Handels- oder andere Arten von Ratschlägen oder Empfehlungen gedacht, die von TradingView bereitgestellt oder gebilligt werden, und stellen diese nicht dar. Lesen Sie mehr in den Nutzungsbedingungen.
Haftungsausschluss
Die Informationen und Veröffentlichungen sind nicht als Finanz-, Anlage-, Handels- oder andere Arten von Ratschlägen oder Empfehlungen gedacht, die von TradingView bereitgestellt oder gebilligt werden, und stellen diese nicht dar. Lesen Sie mehr in den Nutzungsbedingungen.