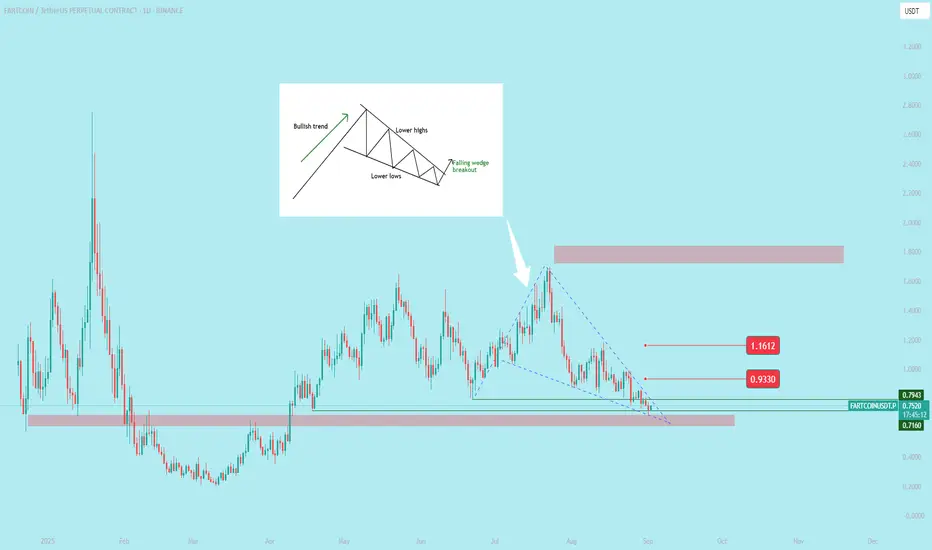
The falling wedge is a bullish chart pattern in technical analysis that signals a potential price reversal to the upside.
Key characteristics of a falling wedge
Downward-sloping trendlines: The pattern is contained by an upper resistance line connecting lower highs and a lower support line connecting lower lows.
Converging lines: The space between the two trendlines narrows as the pattern progresses, indicating a decrease in volatility and easing selling pressure.
Declining volume: Trading volume typically decreases as the wedge forms, which confirms that the downward momentum is fading.
Bulkowski's statistics: According to research by chart pattern expert Thomas Bulkowski, the falling wedge pattern has a higher success rate for upward breakouts (around 68%) than for downward ones, reinforcing its bullish bias.
Haftungsausschluss
Die Informationen und Veröffentlichungen sind nicht als Finanz-, Anlage-, Handels- oder andere Arten von Ratschlägen oder Empfehlungen gedacht, die von TradingView bereitgestellt oder gebilligt werden, und stellen diese nicht dar. Lesen Sie mehr in den Nutzungsbedingungen.
Haftungsausschluss
Die Informationen und Veröffentlichungen sind nicht als Finanz-, Anlage-, Handels- oder andere Arten von Ratschlägen oder Empfehlungen gedacht, die von TradingView bereitgestellt oder gebilligt werden, und stellen diese nicht dar. Lesen Sie mehr in den Nutzungsbedingungen.