You might want to read and watch some You Tube video's on: Day Trading with Pivot Points Strategy
* Always use 5 minute time frames to do the following:
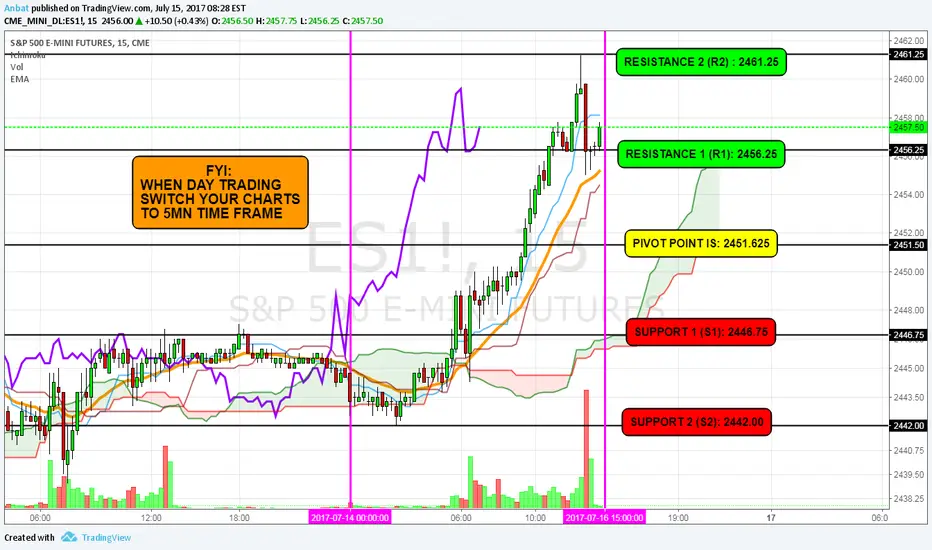
Previous days: High, Low & Close
Pivot Point (P)= (High + Low + close) divided by 3
Support 1 (S1) = (P x 2) – High
Support 2 (S2) = P – (High – Low)
Resistance 1 (R1) = (P x 2) – Low
Resistance 2 (R2) = P + (High - Low)
Yes, you can put a 3rd Support and Resistance on your charts, if you would like too. I can't put a 5 minute chart here (so PRETEND), noted 15 mn is a 5mn one.
* Always use 5 minute time frames to do the following:
Previous days: High, Low & Close
Pivot Point (P)= (High + Low + close) divided by 3
Support 1 (S1) = (P x 2) – High
Support 2 (S2) = P – (High – Low)
Resistance 1 (R1) = (P x 2) – Low
Resistance 2 (R2) = P + (High - Low)
Yes, you can put a 3rd Support and Resistance on your charts, if you would like too. I can't put a 5 minute chart here (so PRETEND), noted 15 mn is a 5mn one.
Haftungsausschluss
Die Informationen und Veröffentlichungen sind nicht als Finanz-, Anlage-, Handels- oder andere Arten von Ratschlägen oder Empfehlungen gedacht, die von TradingView bereitgestellt oder gebilligt werden, und stellen diese nicht dar. Lesen Sie mehr in den Nutzungsbedingungen.
Haftungsausschluss
Die Informationen und Veröffentlichungen sind nicht als Finanz-, Anlage-, Handels- oder andere Arten von Ratschlägen oder Empfehlungen gedacht, die von TradingView bereitgestellt oder gebilligt werden, und stellen diese nicht dar. Lesen Sie mehr in den Nutzungsbedingungen.