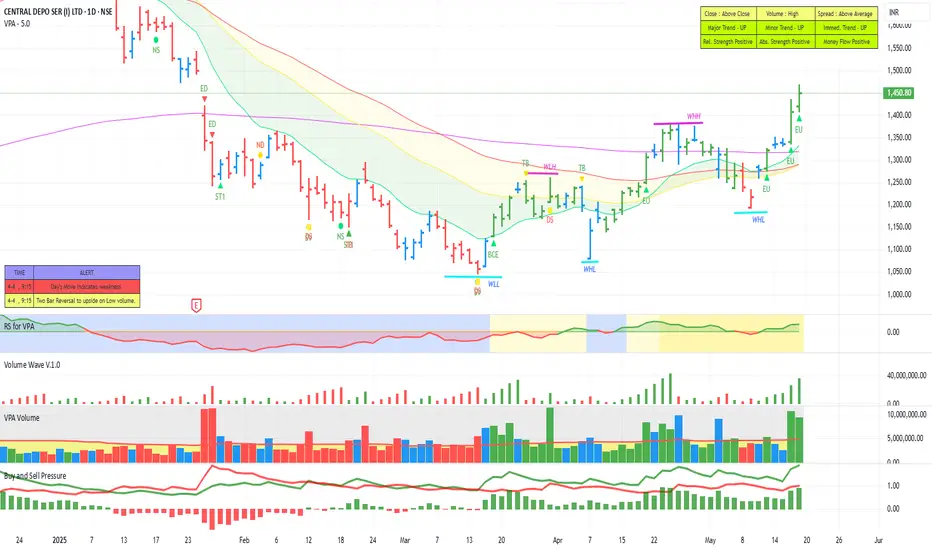
CDSL, another interesting chart for our study. The stock was pushed down almost 48 percent from the its high to below 200 DMA levels and also the short-term moving averages. Then it started recovering. Now it is making higher highs and higher lows on the weekly chart as well. It has gone above the short-term moving averages and the 200 DMA as well. We can see the buying waves are getting much stronger. Also, the buying pressure has been quite positive for some time. Right now, the relative strength and the money flow also have turned positive. Now it seems the stock is setting up for a much bigger move and could see 1900 levels. A pull back to the 20 SMA will be the ideal opportunity for entry.
Disclaimer: This is only for learning purpose and not a recommendation to buy and sell.
Disclaimer: This is only for learning purpose and not a recommendation to buy and sell.
Haftungsausschluss
Die Informationen und Veröffentlichungen sind nicht als Finanz-, Anlage-, Handels- oder andere Arten von Ratschlägen oder Empfehlungen gedacht, die von TradingView bereitgestellt oder gebilligt werden, und stellen diese nicht dar. Lesen Sie mehr in den Nutzungsbedingungen.
Haftungsausschluss
Die Informationen und Veröffentlichungen sind nicht als Finanz-, Anlage-, Handels- oder andere Arten von Ratschlägen oder Empfehlungen gedacht, die von TradingView bereitgestellt oder gebilligt werden, und stellen diese nicht dar. Lesen Sie mehr in den Nutzungsbedingungen.