Disclaimer: This post is purely based on technical chart analysis and is not a recommendation to buy or sell. Please do your own research and consult with a financial advisor before making any investment decisions.
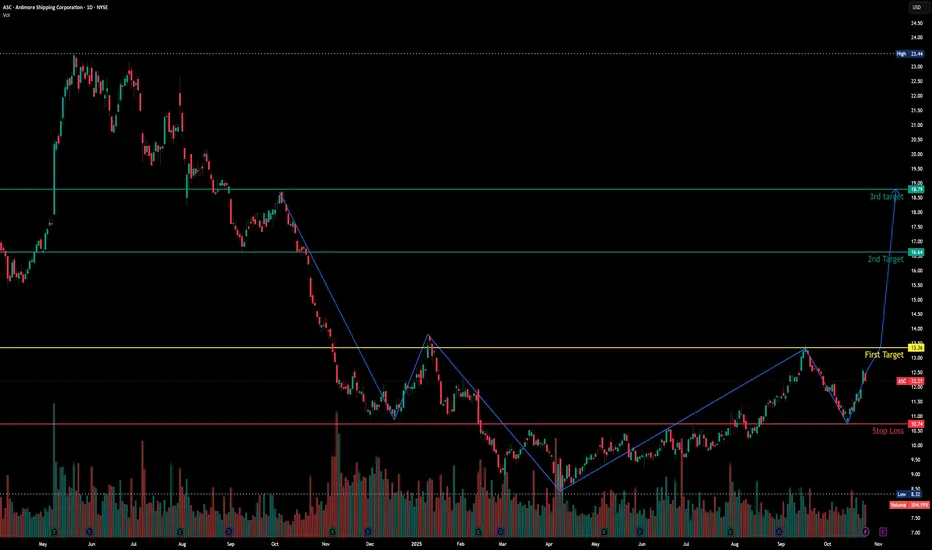
Last Year in May 2024, stock price was at nearly $23. from that level it fall to $8.5.
During this fall and rise, stock has made an inverted Head and Shoulder Chart Pattern.
According to my analysis , i have marked some of levels on the chart for reference.
Please share your thoughts.
Best wishes.
Last Year in May 2024, stock price was at nearly $23. from that level it fall to $8.5.
During this fall and rise, stock has made an inverted Head and Shoulder Chart Pattern.
According to my analysis , i have marked some of levels on the chart for reference.
Please share your thoughts.
Best wishes.
Haftungsausschluss
Die Informationen und Veröffentlichungen sind nicht als Finanz-, Anlage-, Handels- oder andere Arten von Ratschlägen oder Empfehlungen gedacht, die von TradingView bereitgestellt oder gebilligt werden, und stellen diese nicht dar. Lesen Sie mehr in den Nutzungsbedingungen.
Haftungsausschluss
Die Informationen und Veröffentlichungen sind nicht als Finanz-, Anlage-, Handels- oder andere Arten von Ratschlägen oder Empfehlungen gedacht, die von TradingView bereitgestellt oder gebilligt werden, und stellen diese nicht dar. Lesen Sie mehr in den Nutzungsbedingungen.