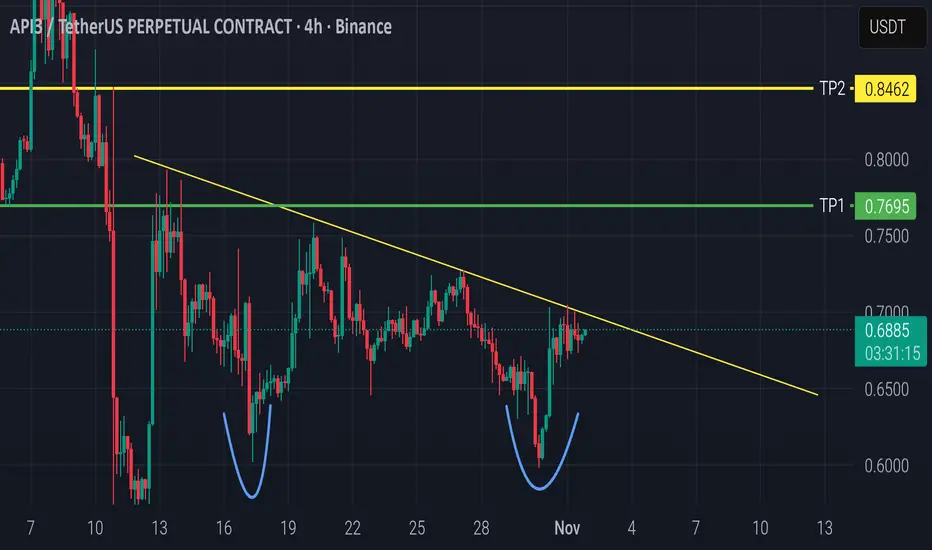
The chart shows a clear Double Bottom pattern around the 0.60 zone, indicating a potential bullish reversal.
Price is now testing the descending trendline (neckline), and a confirmed 4H candle close above 0.69 with strong volume could trigger a breakout move.
🎯 Targets:
TP1: 0.7412
TP2: 0.8462
🛡️ Stop Loss: Below 0.67 or the previous low.
Volume is increasing, supporting the potential breakout — so entry can be considered now if volume keeps rising, or after a retest of the trendline for safer confirmation.
#API3USDT #Crypto #TradingView #TechnicalAnalysis #DoubleBottom #TrendlineBreakout
Haftungsausschluss
Die Informationen und Veröffentlichungen sind nicht als Finanz-, Anlage-, Handels- oder andere Arten von Ratschlägen oder Empfehlungen gedacht, die von TradingView bereitgestellt oder gebilligt werden, und stellen diese nicht dar. Lesen Sie mehr in den Nutzungsbedingungen.
Haftungsausschluss
Die Informationen und Veröffentlichungen sind nicht als Finanz-, Anlage-, Handels- oder andere Arten von Ratschlägen oder Empfehlungen gedacht, die von TradingView bereitgestellt oder gebilligt werden, und stellen diese nicht dar. Lesen Sie mehr in den Nutzungsbedingungen.