ATR ZLEMA [QuantAlgo]🟢 Overview
The ATR ZLEMA indicator identifies trend direction and reversal points using a Zero Lag Exponential Moving Average (ZLEMA) combined with volatility-adjusted dynamic trailing stops. It eliminates the inherent lag of traditional moving averages while incorporating Average True Range (ATR) volatility measurement to create adaptive support and resistance levels that automatically adjust to market conditions, with optional noise filtering to reduce whipsaws in choppy markets, helping traders and investors identify trend changes, maintain positions during trending markets, and exit when momentum shifts across multiple timeframes and asset classes.
🟢 How It Works
The indicator's core methodology lies in its zero-lag trend detection system combined with volatility-adaptive trailing stops, where the ZLEMA eliminates moving average lag while ATR-based bands provide dynamic support and resistance levels:
lag = math.floor((zlemaLength - 1) / 2)
rawZlema = ta.ema(source + (source - source ), zlemaLength)
The Zero Lag EMA calculation uses lag reduction through data compensation, adding the difference between current price and lagged price to eliminate the delay inherent in traditional exponential moving averages, providing faster response to trend changes while maintaining smoothness.
The script incorporates an optional ATR-based noise filter that prevents the ZLEMA from updating during insignificant price movements, helping to reduce false signals in choppy, range-bound markets:
if enableNoiseFilter
noiseThreshold = atr * noiseFilter
priceChange = math.abs(rawZlema - zlema)
if priceChange > noiseThreshold
zlema := rawZlema
First, the indicator calculates the Average True Range to measure current market volatility, then applies a user-defined multiplier to determine the distance of the trailing stop from the ZLEMA:
atr = ta.rma(ta.tr(true), atrLength)
atrBand = atr * atrMultiplier
Next, dynamic trend detection occurs through a state-based system where the indicator tracks whether the ZLEMA is above or below the ATR trailing line, automatically adjusting the trailing stop position:
if trend == 1
if zlema < zlemaATR
trend := -1
zlemaATR := zlema + atrBand
else
zlemaATR := math.max(zlemaATR, zlema - atrBand)
The ATR trailing line acts as a volatility-adjusted stop that follows the ZLEMA during trends but never moves against the trend direction. It ratchets upward with the ZLEMA in uptrends and ratchets downward in downtrends, creating a protective barrier that adapts to market volatility.
Finally, trend reversal signals are generated when the ZLEMA crosses the ATR trailing line, indicating a shift in market momentum:
bullSignal = trend == 1 and trend == -1
bearSignal = trend == -1 and trend == 1
This creates a volatility-adaptive trend-following system that combines ZLEMA with dynamic support/resistance levels and optional noise filtering, providing traders with responsive directional signals and automatic stop-loss levels that adjust to both price momentum and market volatility conditions.
🟢 Signal Interpretation
▶ Bullish Trend (Green): ZLEMA trading above ATR trailing line with indicator showing bullish color, indicating established upward momentum with zero-lag confirmation = Long/Buy opportunities
▶ Bearish Trend (Red): ZLEMA trading below ATR trailing line with indicator showing bearish color, indicating established downward momentum with zero-lag confirmation = Short/Sell opportunities
▶ ATR Trailing Line as Dynamic Support: In uptrends, the trailing line acts as volatility-adjusted support level that rises with ZLEMA, never declining = Use as potential stop-loss reference for long positions = ZLEMA holding above indicates trend strength and momentum continuation
▶ ATR Trailing Line as Dynamic Resistance: In downtrends, the trailing line acts as volatility-adjusted resistance level that falls with ZLEMA, never rising = Use as potential stop-loss reference for short positions = ZLEMA holding below indicates trend weakness and momentum continuation
🟢 Features
▶ Preconfigured Presets: Three optimized parameter sets for different trading styles and market conditions. "Default" provides balanced configuration suitable for swing trading on daily and 4-hour charts with standard ZLEMA and ATR periods, moderate multiplier, and moderate noise filtering that works across most market conditions. "Fast Response" delivers aggressive configuration designed for intraday trading and scalping on 5-minute to 1-hour charts with shorter ZLEMA period for quick trend detection, reduced ATR period for rapid volatility adaptation, tighter multiplier for early entries/exits, and minimal noise filtering for maximum responsiveness. This is ideal for active traders monitoring positions closely but expect more frequent signals and potential whipsaws in choppy conditions. "Smooth Trend" focuses on conservative configuration for position trading and long-term trend following on daily to weekly charts with extended ZLEMA period for smoother trend identification, longer ATR period for stable volatility measurement, wide multiplier to filter minor corrections, and aggressive noise filtering to ensure only strong sustained trends trigger signals. This is best for patient traders focused on major trend moves with fewer reversals.
▶ Built-in Alerts: Three alert conditions enable comprehensive automated monitoring of trend changes and zero-lag momentum shifts. "Bullish Trend" triggers when the ZLEMA crosses above the ATR trailing line and trend state changes from bearish to bullish, signaling potential long entry opportunities with lag-eliminated confirmation. "Bearish Trend" activates when the ZLEMA crosses below the ATR trailing line and trend state changes from bullish to bearish, signaling potential short entry or long exit points with immediate momentum detection. "Any Trend Change" provides a combined alert for any trend reversal regardless of direction, allowing traders to be notified of all zero-lag momentum shifts without setting up separate alerts. These notifications enable traders to capitalize on trend changes and protect positions without continuous chart monitoring, leveraging the indicator's zero-lag technology for faster trend change alerts.
▶ Color Customization: Six visual themes (Classic, Aqua, Cosmic, Ember, Neon, plus Custom) accommodate different chart backgrounds and visual preferences, ensuring optimal contrast for identifying bullish versus bearish trends across various trading environments. The adjustable cloud fill transparency control (0-100%) allows fine-tuning of the gradient area prominence between the ATR trailing line and ZLEMA, with higher transparency values (70-95) creating subtle background context without overwhelming the chart while lower values (20-40) produce bold, prominent trend zone emphasis for instant recognition. Optional bar coloring with adjustable transparency (0-100%) extends the trend color directly to the price bars themselves based on ZLEMA trend state, providing immediate visual reinforcement of current trend direction without requiring reference to the indicator lines.
Zero Lag Exponential Moving Average (ZLEMA)

ZLEMA FusionZLEMA Fusion - Advanced Zero-Lag Momentum & Trailing Stop System
A sophisticated overlay indicator combining the power of Zero Lag EMA (ZLEMA) with ATR-based Moving Stop (MOST) for precision trend following and dynamic support/resistance tracking.
Core Components:
1. ZLEMA (Zero Lag Exponential Moving Average)
Eliminates lag inherent in traditional EMAs
Provides faster response to price changes
Customizable length for different trading styles
Smooth, responsive trend line
2. MOST (Moving Stop - ATR Trailing Stop)
Dynamic ATR-based trailing stop system
Automatically adjusts to market volatility
Never moves backward - only trails in favourable direction
Green line = Uptrend support | Red line = Downtrend resistance
Customizable ATR multiplier and lookback period
Signal Generation:
BUY (⇑): When ZLEMA crosses above MOST
SELL (⇓): When ZLEMA crosses below MOST
Clean visual arrows with no label boxes
Signals trigger on candle close only (no repainting)
Advanced Features:
✅ Signal Cooldown System - Prevents signal spam with configurable minimum bars between signals
✅ ADX Trend Strength Filter - Optional filter to trade only in strong trends
✅ Higher Timeframe ZLEMA Confirmation - Multi-timeframe trend alignment for higher probability setups
✅ Background Color Coding - Quick visual trend identification (Green = Uptrend, Red = Downtrend)
✅ Alert System - Built-in alerts for buy and sell signals
Fully Customizable:
ZLEMA length
ATR period and multiplier
MOST lookback period
Signal cooldown bars
ADX filter threshold
Higher timeframe settings
Visual display options
Best Used For:
Index trading
Swing trading
Trend following strategies
Dynamic support/resistance identification
Entry/exit timing
Optimized for Indian Markets - Calibrated for Nifty, Bank Nifty, and other NSE instruments.
⚠️ Important Notes:
This indicator is for educational purposes
No repainting - all signals confirmed at candle close
Use proper risk management
Combine with your trading plan and additional confirmation

Zero Lag Trend Signals (MTF) [Quant Trading] V7Overview
The Zero Lag Trend Signals (MTF) V7 is a comprehensive trend-following strategy that combines Zero Lag Exponential Moving Average (ZLEMA) with volatility-based bands to identify high-probability trade entries and exits. This strategy is designed to reduce lag inherent in traditional moving averages while incorporating dynamic risk management through ATR-based stops and multiple exit mechanisms.
This is a longer term horizon strategy that takes limited trades. It is not a high frequency trading and therefore will also have limited data and not > 100 trades.
How It Works
Core Signal Generation:
The strategy uses a Zero Lag EMA (ZLEMA) calculated by applying an EMA to price data that has been adjusted for lag:
Calculate lag period: floor((length - 1) / 2)
Apply lag correction: src + (src - src )
Calculate ZLEMA: EMA of lag-corrected price
Volatility bands are created using the highest ATR over a lookback period multiplied by a band multiplier. These bands are added to and subtracted from the ZLEMA line to create upper and lower boundaries.
Trend Detection:
The strategy maintains a trend variable that switches between bullish (1) and bearish (-1):
Long Signal: Triggers when price crosses above ZLEMA + volatility band
Short Signal: Triggers when price crosses below ZLEMA - volatility band
Optional ZLEMA Trend Confirmation:
When enabled, this filter requires ZLEMA to show directional momentum before entry:
Bullish Confirmation: ZLEMA must increase for 4 consecutive bars
Bearish Confirmation: ZLEMA must decrease for 4 consecutive bars
This additional filter helps avoid false signals in choppy or ranging markets.
Risk Management Features:
The strategy includes multiple stop-loss and take-profit mechanisms:
Volatility-Based Stops: Default stop-loss is placed at ZLEMA ± volatility band
ATR-Based Stops: Dynamic stop-loss calculated as entry price ± (ATR × multiplier)
ATR Trailing Stop: Ratcheting stop-loss that follows price but never moves against position
Risk-Reward Profit Target: Take-profit level set as a multiple of stop distance
Break-Even Stop: Moves stop to entry price after reaching specified R:R ratio
Trend-Based Exit: Closes position when price crosses EMA in opposite direction
Performance Tracking:
The strategy includes optional features for monitoring and analyzing trades:
Floating Statistics Table: Displays key metrics including win rate, GOA (Gain on Account), net P&L, and max drawdown
Trade Log Labels: Shows entry/exit prices, P&L, bars held, and exit reason for each closed trade
CSV Export Fields: Outputs trade data for external analysis
Default Strategy Settings
Commission & Slippage:
Commission: 0.1% per trade
Slippage: 3 ticks
Initial Capital: $1,000
Position Size: 100% of equity per trade
Main Calculation Parameters:
Length: 70 (range: 70-7000) - Controls ZLEMA calculation period
Band Multiplier: 1.2 - Adjusts width of volatility bands
Entry Conditions (All Disabled by Default):
Use ZLEMA Trend Confirmation: OFF - Requires ZLEMA directional momentum
Re-Enter on Long Trend: OFF - Allows multiple entries during sustained trends
Short Trades:
Allow Short Trades: OFF - Strategy is long-only by default
Performance Settings (All Disabled by Default):
Use Profit Target: OFF
Profit Target Risk-Reward Ratio: 2.0 (when enabled)
Dynamic TP/SL (All Disabled by Default):
Use ATR-Based Stop-Loss & Take-Profit: OFF
ATR Length: 14
Stop-Loss ATR Multiplier: 1.5
Profit Target ATR Multiplier: 2.5
Use ATR Trailing Stop: OFF
Trailing Stop ATR Multiplier: 1.5
Use Break-Even Stop-Loss: OFF
Move SL to Break-Even After RR: 1.5
Use Trend-Based Take Profit: OFF
EMA Exit Length: 9
Trade Data Display (All Disabled by Default):
Show Floating Stats Table: OFF
Show Trade Log Labels: OFF
Enable CSV Export: OFF
Trade Label Vertical Offset: 0.5
Backtesting Date Range:
Start Date: January 1, 2018
End Date: December 31, 2069
Important Usage Notes
Default Configuration: The strategy operates in its most basic form with default settings - using only ZLEMA crossovers with volatility bands and volatility-based stop-losses. All advanced features must be manually enabled.
Stop-Loss Priority: If multiple stop-loss methods are enabled simultaneously, the strategy will use whichever condition is hit first. ATR-based stops override volatility-based stops when enabled.
Long-Only by Default: Short trading is disabled by default. Enable "Allow Short Trades" to trade both directions.
Performance Monitoring: Enable the floating stats table and trade log labels to visualize strategy performance during backtesting.
Exit Mechanisms: The strategy can exit trades through multiple methods: stop-loss hit, take-profit reached, trend reversal, or trailing stop activation. The trade log identifies which exit method was used.
Re-Entry Logic: When "Re-Enter on Long Trend" is enabled with ZLEMA trend confirmation, the strategy can take multiple long positions during extended uptrends as long as all entry conditions remain valid.
Capital Efficiency: Default setting uses 100% of equity per trade. Adjust "default_qty_value" to manage position sizing based on risk tolerance.
Realistic Backtesting: Strategy includes commission (0.1%) and slippage (3 ticks) to provide realistic performance expectations. These values should be adjusted based on your broker and market conditions.
Recommended Use Cases
Trending Markets: Best suited for markets with clear directional moves where trend-following strategies excel
Medium to Long-Term Trading: The default length of 70 makes this strategy more appropriate for swing trading rather than scalping
Risk-Conscious Traders: Multiple stop-loss options allow traders to customize risk management to their comfort level
Backtesting & Optimization: Comprehensive performance tracking features make this strategy ideal for testing different parameter combinations
Limitations & Considerations
Like all trend-following strategies, performance may suffer in choppy or ranging markets
Default 100% position sizing means full capital exposure per trade - consider reducing for conservative risk management
Higher length values (70+) reduce signal frequency but may improve signal quality
Multiple simultaneous risk management features may create conflicting exit signals
Past performance shown in backtests does not guarantee future results
Customization Tips
For more aggressive trading:
Reduce length parameter (minimum 70)
Decrease band multiplier for tighter bands
Enable short trades
Use lower profit target R:R ratios
For more conservative trading:
Increase length parameter
Enable ZLEMA trend confirmation
Use wider ATR stop-loss multipliers
Enable break-even stop-loss
Reduce position size from 100% default
For optimal choppy market performance:
Enable ZLEMA trend confirmation
Increase band multiplier
Use tighter profit targets
Avoid re-entry on trend continuation
Visual Elements
The strategy plots several elements on the chart:
ZLEMA line (color-coded by trend direction)
Upper and lower volatility bands
Long entry markers (green triangles)
Short entry markers (red triangles, when enabled)
Stop-loss levels (when positions are open)
Take-profit levels (when enabled and positions are open)
Trailing stop lines (when enabled and positions are open)
Optional ZLEMA trend markers (triangles at highs/lows)
Optional trade log labels showing complete trade information
Exit Reason Codes (for CSV Export)
When CSV export is enabled, exit reasons are coded as:
0 = Manual/Other
1 = Trailing Stop-Loss
2 = Profit Target
3 = ATR Stop-Loss
4 = Trend Change
Conclusion
Zero Lag Trend Signals V7 provides a robust framework for trend-following with extensive customization options. The strategy balances simplicity in its core logic with sophisticated risk management features, making it suitable for both beginner and advanced traders. By reducing moving average lag while incorporating volatility-based signals, it aims to capture trends earlier while managing risk through multiple configurable exit mechanisms.
The modular design allows traders to start with basic trend-following and progressively add complexity through ZLEMA confirmation, multiple stop-loss methods, and advanced exit strategies. Comprehensive performance tracking and export capabilities make this strategy an excellent tool for systematic testing and optimization.
Note: This strategy is provided for educational and backtesting purposes. All trading involves risk. Past performance does not guarantee future results. Always test thoroughly with paper trading before risking real capital, and adjust position sizing and risk parameters according to your risk tolerance and account size.
================================================================================
TAGS:
================================================================================
trend following, ZLEMA, zero lag, volatility bands, ATR stops, risk management, swing trading, momentum, trend confirmation, backtesting
================================================================================
CATEGORY:
================================================================================
Strategies
================================================================================
CHART SETUP RECOMMENDATIONS:
================================================================================
For optimal visualization when publishing:
Use a clean chart with no other indicators overlaid
Select a timeframe that shows multiple trade signals (4H or Daily recommended)
Choose a trending asset (crypto, forex major pairs, or trending stocks work well)
Show at least 6-12 months of data to demonstrate strategy across different market conditions
Enable the floating stats table to display key performance metrics
Ensure all indicator lines (ZLEMA, bands, stops) are clearly visible
Use the default chart type (candlesticks) - avoid Heikin Ashi, Renko, etc.
Make sure symbol information and timeframe are clearly visible
================================================================================
COMPLIANCE NOTES:
================================================================================
✅ Open-source publication with complete code visibility
✅ English-only title and description
✅ Detailed explanation of methodology and calculations
✅ Realistic commission (0.1%) and slippage (3 ticks) included
✅ All default parameters clearly documented
✅ Performance limitations and risks disclosed
✅ No unrealistic claims about performance
✅ No guaranteed results promised
✅ Appropriate for public library (original trend-following implementation with ZLEMA)
✅ Educational disclaimers included
✅ All features explained in detail
================================================================================

ZLEMA Trend Index 2.0ZTI — ZLEMA Trend Index 2.0 (0–1000)
Overview
Price Mapped ZTI v2.0 - Enhanced Zero-Lag Trend Index.
This indicator is a significant upgrade to the original ZTI v1.0, featuring enhanced resolution from 0-100 to 0-1000 levels for dramatically improved price action accuracy. The Price Mapped ZTI uses direct price-to-level mapping to eliminate statistical noise and provide true proportional representation of market movements.
Key Innovation: Instead of statistical normalization, this version maps current price position within a user-defined lookback period directly to the ZTI scale, ensuring perfect correlation with actual price movements. I believe this is the best way to capture trends instead of directly on the charts using a plethora of indicators which introduces bad signals resulting in drawdowns. The RSI-like ZTI overbought and oversold lines filter valid trends by slicing through the current trading zone. Unlike RSI that can introduce false signals, the ZTI levels 1 to 1000 is faithfully mapped to the lowest to highest price in the current trading zone (lookback period in days) which can be changed in the settings. The ZTI line will never go off the beyond the ZTI levels in case of extreme trend continuation as the trading zone is constantly updated to reflect only the most recent bars based on lookback days.
Core Features
✅ 10x Higher Resolution - 0-1000 scale provides granular movement detection
✅ Adjustable Trading Zone - Customizable lookback period from 1-50 days
✅ Price-Proportional Mapping - Direct correlation between price position and ZTI level
✅ Zero Statistical Lag - No rolling averages or standard deviation calculations
✅ Multi-Strategy Adaptability - Single parameter adjustment for different trading styles
Trading Zone Optimization
📊 Lookback Period Strategies
Short-term (1-3 days):
Ultra-responsive to recent price action
Perfect for scalping and day trading
Tight range produces more sensitive signals
Medium-term (7-14 days):
Balanced view of recent trading range
Ideal for swing trading
Captures meaningful support/resistance levels
Long-term (21-30 days):
Broader market context
Excellent for position trading
Smooths out short-term market noise
⚡ Market Condition Adaptation
Volatile Markets: Use shorter lookback (3-5 days) for tighter ranges
Trending Markets: Use longer lookback (14-21 days) for broader context
Ranging Markets: Use medium lookback (7-10 days) for clear boundaries
🎯 Timeframe Optimization
1-minute charts: 1-2 day lookback
5-minute charts: 2-5 day lookback
Hourly charts: 7-14 day lookback
Daily charts: 21-50 day lookback
Trading Applications
Scalping Setup (2-day lookback):
Super tight range for quick reversals
ZTI 800+ = immediate short opportunity
ZTI 200- = immediate long opportunity
Swing Trading Setup (10-day lookback):
Meaningful swing levels captured
ZTI extremes = high-probability reversal zones
More stable signals, reduced whipsaws
Advanced Usage
🔧 Real-Time Adaptability
Trending days: Increase to 14+ days for broader perspective
Range-bound days: Decrease to 3 days for tighter signals
High volatility: Shorter lookback for responsiveness
Low volatility: Longer lookback to avoid false signals
💡 Multi-Timeframe Approach
Entry signals: Use 7-day ZTI on main timeframe
Trend confirmation: Use 21-day ZTI on higher timeframe
Exit timing: Use 3-day ZTI for precise exits
🌐 Session Optimization
Asian session: Shorter lookback (3-5 days) for range-bound conditions
London/NY session: Longer lookback (7-14 days) for trending conditions
How It Works
The indicator maps the current price position within the specified lookback period directly to a 0-1000 scale and plots it using ZLEMA (Zero Lag Exponential Moving Average) which has the least lag of the available popular moving averages:
Price at recent high = ZTI at 1000
Price at recent low = ZTI at 1
Price at mid-range = ZTI at 500
This creates perfect proportional representation where every price movement translates directly to corresponding ZTI movement, eliminating the false signals common in traditional oscillators.
This single, versatile indicator adapts to any market condition, timeframe, or trading style through one simple parameter adjustment, making it an essential tool for traders at every level.
Credits
ZLEMA techniques widely attributed to John Ehlers.
Disclaimer
This tool is for educational purposes only and is not financial advice. Backtest and forward‑test before live use, and always manage risk.
Please note that I set this as closed source to prevent source code cloning by others, repackaging and republishing which results in multiple confusing choices of the same indicator.

Z-scored ZLEMA | OquantZ-Scored ZLEMA | Oquant
This indicator combines the Zero-Lag Exponential Moving Average (ZLEMA) with Z-score normalization to present recent ZLEMA values relative to its mean. It helps users observe trend direction and momentum with reduced lag, while also highlighting potential overbought or oversold levels based on how far ZLEMA values deviate from their mean.
🧠 Concept Overview
📉 Zero Lag Exponential Moving Average (ZLEMA)
The EMA is a popular tool that calculates an average price, but unlike a simple moving average, it gives more weight to recent prices. This means the EMA reacts faster to new price changes and is less affected by older data. However, even with this weighting, the EMA still introduces some lag.
ZLEMA improves on the EMA by reducing this lag. It does this by adjusting how it accounts for previous prices, effectively "shifting" the data to better align the average with current market action. The result is an average that stays smooth but responds more quickly to real price changes—helping traders spot turning points or trend shifts earlier without being fooled by random noise.
📏 Z-score Normalization
Once ZLEMA is calculated, the indicator applies Z-score normalization to measure how far the current ZLEMA value is from its mean. The Z-score expresses this difference using standard deviations, providing a clear, standardized scale. This helps highlight when price moves are unusually strong—either upward or downward—beyond normal fluctuations.
🔍 How This Indicator Works
Smooth Price Data with ZLEMA
The indicator begins by applying the Zero-Lag Exponential Moving Average (ZLEMA) to the chosen price data. Unlike a regular moving average, ZLEMA reduces the typical delay by adjusting the input data before averaging. It does this by "shifting" the price series to remove the lag caused by older prices. This way, ZLEMA stays smooth but reacts more quickly to recent price changes—helping the indicator follow market moves faster without being too noisy.
Normalize ZLEMA values Using Z-score
Once ZLEMA is calculated, the indicator applies Z-score normalization to measure how far the current ZLEMA value is from its mean. The Z-score expresses this difference in terms of standard deviations, creating a clear, standardized scale. This helps highlight when price moves are unusually strong—either up or down—beyond normal fluctuations.
Set Signal Thresholds
Two threshold levels are set on the Z-score scale—crossing above the upper threshold is considered a long (buy) signal, indicating bullish momentum, while crossing below the lower threshold is considered a short (sell) signal, indicating bearish momentum.
Show Visual Signals on the Chart
The Z-score and bars are plotted with colors: green when Z-score is above the bullish threshold, purple when Z-score is below the bearish threshold.
⚙️ Customizable Inputs
Source: Choose the price source (close, open, etc.) for calculations.
ZLEMA Length: Adjust the ZLEMA length to control smoothness versus responsiveness.
Z-score period: Set the Z-score period to define how far back the indicator measures normal price behavior.
Thresholds: Adjust the upper and lower thresholds to control how sensitive the indicator is to strong momentum changes.
📈 Practical Use
This indicator helps identify trend directions and changes faster by combining ZLEMA with statistical analysis. It highlights when price moves are stronger than normal, making it easier to spot early signs of momentum shifts. Traders can use it to confirm trends or detect potential reversals with more timely signals.
🔔 Alert Support
This indicator includes optional built-in alert conditions that notify you when the Z-score crosses above the bullish threshold (long signal) or below the bearish threshold (short signal). You can enable these alerts to get timely updates on potential momentum shifts without constantly watching the chart.
⚠️ Disclaimer: This indicator is intended for educational and informational purposes only. Trading/investing involves risk, and past performance does not guarantee future results. Always test and evaluate indicators/strategies before applying them in live markets. Use at your own risk.

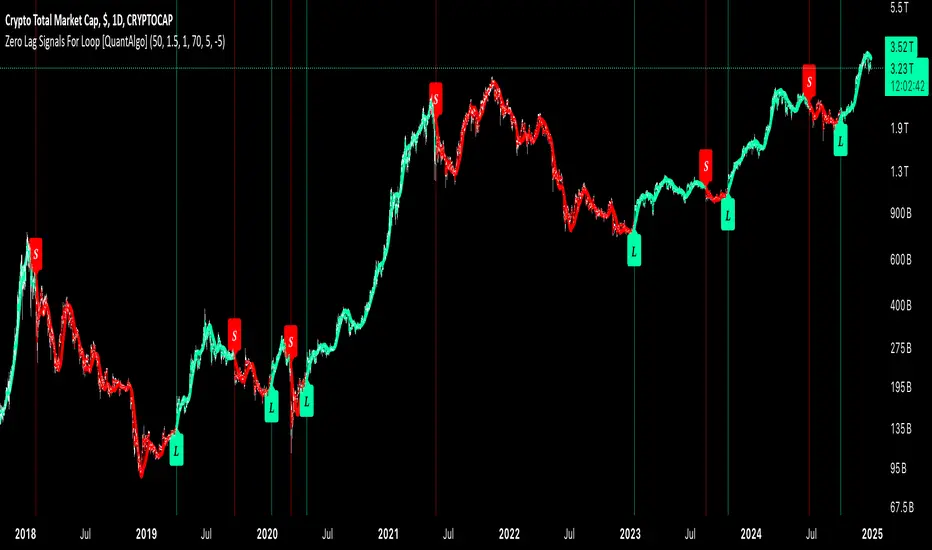
Zero Lag Signals For Loop [QuantAlgo]Elevate your trend-following investing and trading strategy with Zero Lag Signals For Loop by QuantAlgo , a simple yet effective technical indicator that merges advanced zero-lag mechanism with adaptive trend analysis to bring you a fresh take on market momentum tracking. Its aim is to support both medium- to long-term investors monitoring broader market shifts and precision-focused traders seeking quality entries through its dual-focused analysis approach!
🟢 Core Architecture
The foundation of this indicator rests on its zero-lag implementation and dynamic trend assessment. By utilizing a loop-driven scoring system alongside volatility-based filtering, each market movement is evaluated through multiple historical lenses while accounting for current market conditions. This multi-layered approach helps differentiate between genuine trend movements and market noise across timeframe and asset classes.
🟢 Technical Foundation
Three distinct components of this indicator are:
Zero Lag EMA : An enhanced moving average calculation designed to minimize traditional lag effects
For Loop Scoring System : A comprehensive scoring mechanism that weighs current price action against historical contexts
Dynamic Volatility Analysis : A sophisticated ATR-based filter that adjusts signal sensitivity to market conditions
🟢 Key Features & Signals
The Zero Lag Signals For Loop provides market insights through:
Color-coded Zero Lag line that adapts to trend direction
Dynamic fills between price and Zero Lag basis for enhanced visualization
Trend change markers (L/S) that highlight potential reversal points
Smart bar coloring that helps visualize market momentum
Background color changes with vertical lines at significant trend shifts
Customizable alerts for both bullish and bearish reversals
🟢 Practical Usage Tips
Here's how you can get the most out of the Zero Lag Signals For Loop :
1/ Setup:
Add the indicator to your TradingView chart by clicking on the star icon to add it to your favorites ⭐️
Start with the default Zero Lag length for balanced sensitivity
Use the standard volatility multiplier for proper filtering
Keep the default loop range for comprehensive trend analysis
Adjust threshold levels based on your investing and/or trading style
2/ Reading Signals:
Watch for L/S markers - they indicate validated trend reversals
Pay attention to Zero Lag line color changes - they confirm trend direction
Monitor bar colors for additional trend confirmation
Configure alerts for trend changes in both bullish and bearish directions, ensuring you can act on significant technical developments promptly.
🟢 Pro Tips
Fine-tune the Zero Lag length based on your timeframe:
→ Lower values (20-40) for more responsive signals
→ Higher values (60-100) for stronger trend confirmation
Adjust volatility multiplier based on market conditions:
→ Increase multiplier in volatile markets
→ Decrease multiplier in stable trending markets
Combine with:
→ Volume analysis for trade validation
→ Multiple timeframe analysis for broader context
→ Other technical tools for comprehensive analysis
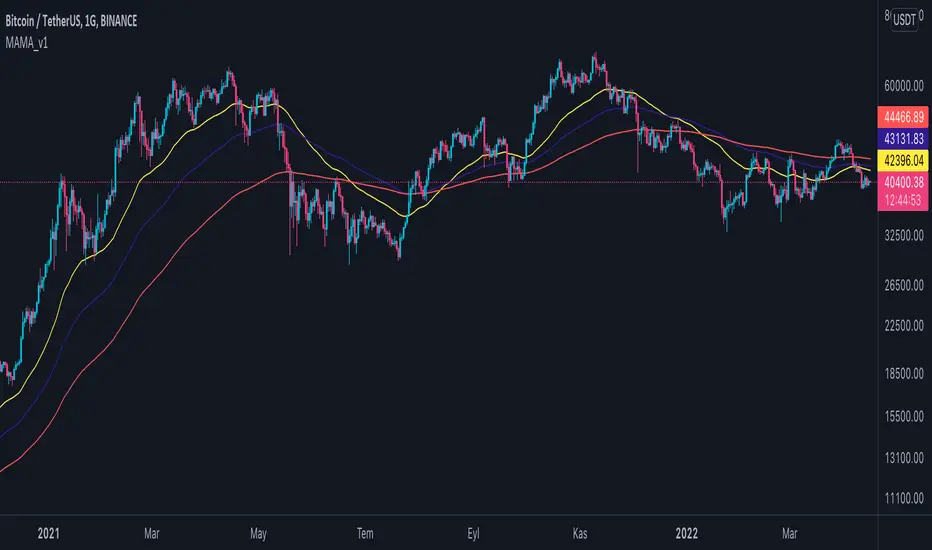
Multi Adjustable Moving Averages(MAMA) with Auto FibonacciMulti Adjustable Moving Averages(MAMA) with Auto Fibonacci
There are 10 moving averages in this indicator. There are 8 different types of moving averages to choose from.
You can also easily set the desired periods, colors and line thicknesses for each moving average from the first page.
It contains Auto Fibonacci as it is used a lot with moving averages. Those who want can easily add from the interface.
Below are the types of moving averages included;
SMA : Simple Moving Average
EMA : Exponential Moving Average
WMA : Weighted Moving Average
TMA : Triangular Moving Average
VAR : Variable Index Dynamic Moving Average a.k.a. VIDYA
WWMA : Welles Wilder's Moving Average
ZLEMA : Zero Lag Exponential Moving Average
TSF : True Strength Force
Alert ;
You can set an alarm on the cross(over or under) of the moving averages you want.
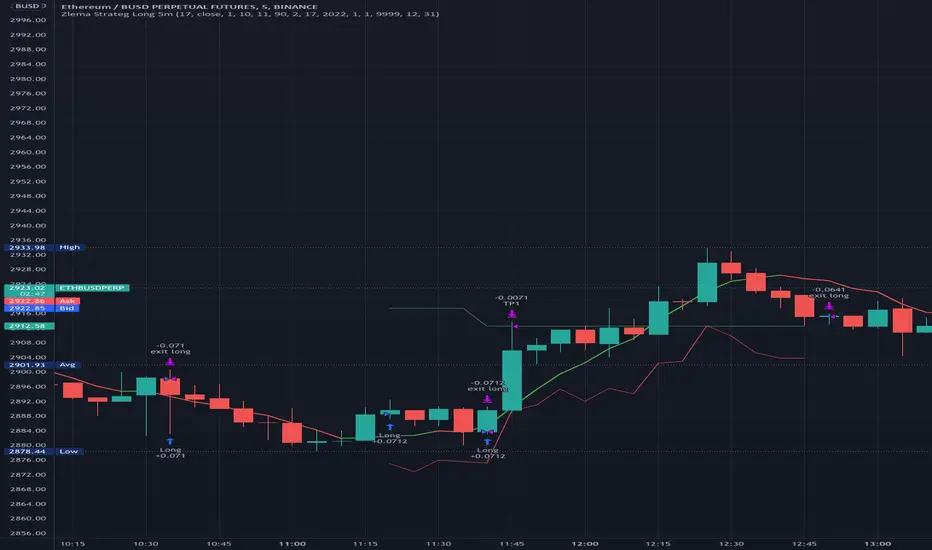
Zlema Strateg Long 5mJust putting this out there.
I created this Strategy based on Everget Zlema.
Opens long trade when Zlema changes color.
It is profitable as it is, but just putting it out to the community to see if someone else has ideas to make it better.
How to make this strategy better?
1. FInd a way to filter ranging bad trades.
2. Trades would be more profitable if entry point had an entry on the candle the zlema changes color.
3. I had to put TP 5 limit, but the optimal would be when the zlema changes color back to red (if ranging trades can we filtered that is).
In any case, just putting it out there, hope it is useful for someone, and I am open to suggestions.
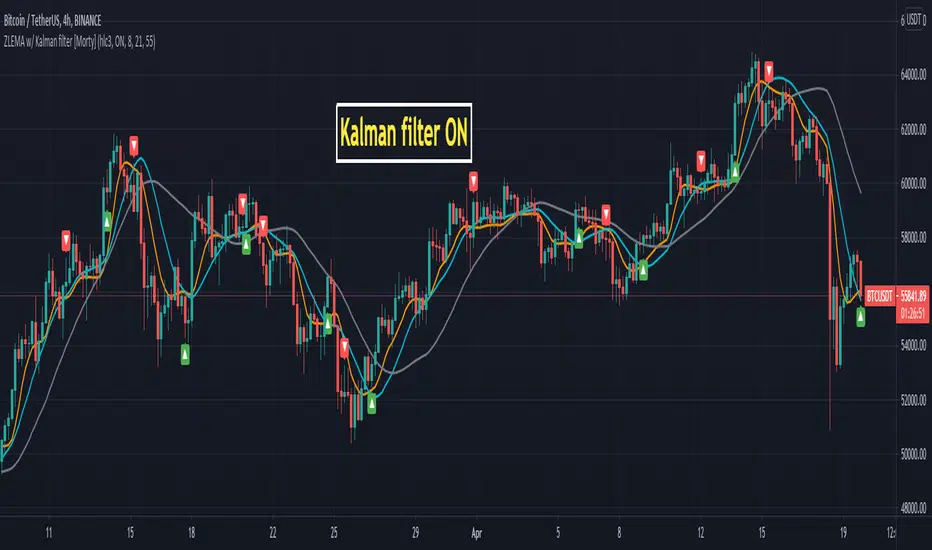
ZLEMA Zero lag EMA with Kalman filter [Morty]This indicator plot 3 Kalman filter zero lag EMA lines. It has less lag and is also smoother than the original EMA.
It also has an option to show the crossover of two EMAs.
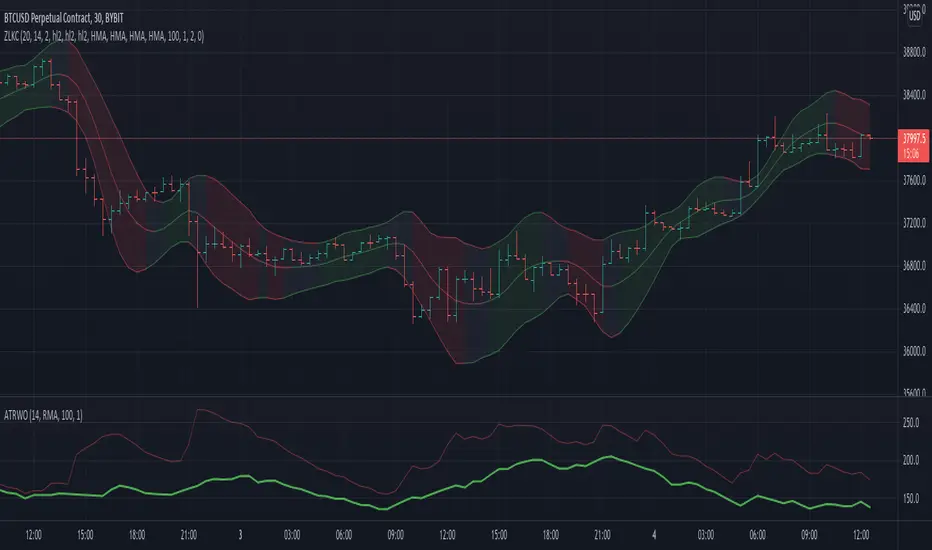
MA Streak Change ChannelChange Channel is like KC unless it uses percentage changes in price to set channel distance. Midline is zero-lag smoothed ROC with dynamic period based on MA Streak indicator, if MA Streak shows an ongoing trend, midline going strong and break out the channel.
Consider using ▲ green areas as a signal to buy and ▼ red areas as a sell signal. It works best in a flat market. Use in combination with other indicators.

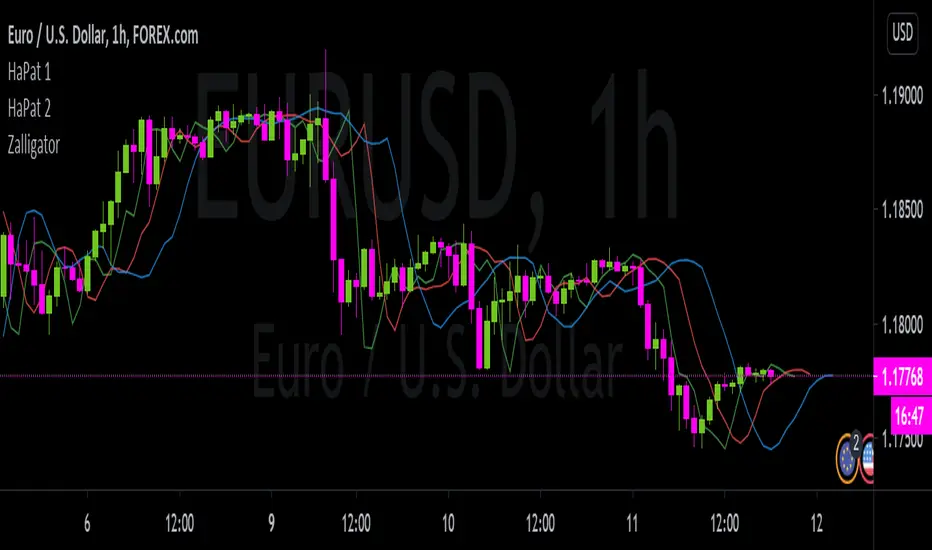
Zalligator - Zero-Lag Alligator IndicatorI applied the zero-lag moving average theory to the Alligator Indicator. It seems like some different rules would would be required versus the traditional Alligator. Let me know what you think!
Dynamic Dots Dashboard (a Cloud/ZLEMA Composite)The purpose of this indicator is to provide an easy-to-read binary dashboard of where the current price is relative to key dynamic supports and resistances. The concept is simple, if a dynamic s/r is currently acting as a resistance, the indicator plots a dot above the histogram in the red box. If a dynamic s/r is acting as support, a dot is plotted in the green box below.
There are some additional features, but the dot graphs are king.
_______________________________________________________________________________________________________________
KEY:
_______________________________________________________________________________________________________________
Currently the dynamic s/r's being used in the dot plots are:
Ichimoku Cloud:
Tenkan (blue)
Kijun (pink)
Senkou A (red)
Senkou B (green)
ZLEMA (Zero Lag Exponential Moving Average)
99 ZLEMA (lavender)
200 ZLEMA (salmon)
You'll see a dashed line through the middle of the resistances section (red) and supports section (green). Cloud indicators are plotted above the dashed line, and ZLEMA's are below.
_______________________________________________________________________________________________________________
How it Works - Visual
_______________________________________________________________________________________________________________
As stated in the intro - if a dynamic s/r is currently above the current price and acting as a resistance, the indicator plots a dot above the histogram in the red box. If a dynamic s/r is acting as support, a dot is plotted in the green box below. Additionally, there is an optional histogram (default is on) that will further visualize this relationship. The histogram is a simple summation of the resistances above and the supports below.
Here's a visual to assist with what that means. This chart includes all of those dynamic s/r's in the dynamic dot dashboard (the on-chart parts are individually added, not part of this tool).
You can see that as a dynamic support is lost, the corresponding dot is moved from the supports section at the bottom (green), to the resistances section at the top (red). The opposite being true as resistances are being overtaken (broken resistances are moved to the support section (red)). You can see that the raw chart is just... a mess. Which kinda of accentuates one of the key goals of this indicator: to get all that dynamic support info without a mess of a chart like that.
_______________________________________________________________________________________________________________
How To Use It
_______________________________________________________________________________________________________________
There are a lot of ways to use this information, but the most notable of which is to detect shifts in the market cycle.
For this example, take a look at the dynamic s/r dots in the resistances category (red background). You can see clearly that there are distinctive blocks of high density dots that have clear beginnings and ends. When we transition from a high density of dots to none in resistances, that means we are flipping them as support and entering a bull cycle. On the other hand, when we go from low density of dots as resistances to high density, we're pivoting to a bear cycle. Easy as that, you can quickly detect when market cycles are beginning or ending.
Alternatively, you can add your preferred linear SR's, fibs, etc. to the chart and quickly glance at the dashboard to gauge how dynamic SR's may be contributing to the risk of your trade.
_______________________________________________________________________________________________________________
Who It's For
_______________________________________________________________________________________________________________
New traders: by looking at dot density alone, you can use Dot Dynamics to spot transitionary phases in market cycles.
Experienced traders: keep your charts clean and the information easy to digest.
Developers: I created this originally as a starting point for more complex algos I'm working on. One algo is reading this dot dashboard and taking a position size relative to the s/r's above and below. Another cloud algo is using the results as inputs to spot good setups.
Colored Bars
There is an option (off by default, shown in the headline image above) to fill the bar colors based on how many dynamic s/r's are above or below the current price. This can make things easier for some users, confusing for others. I defaulted them to off as I don't want colors to confuse the primary value proposition of the indicators, which is the dot heat map. You can turn on colored bars in the settings.
One thing to note with the colored bars: they plot the color purely by the dot densities. Random spikes in the gradient colors (i.e. red to lime or green) can be a useful thing to notice, as they commonly occur at places where the price is bouncing between dynamic s/r's and can indicate a paradigm shift in the market cycle.
_______________________________________________________________________________________________________________
Timeframes and Assets
_______________________________________________________________________________________________________________
This can be used effectively on all assets (stocks, crypto, forex, etc) and all time frames. As always with any indicator, the higher TF's are generally respected more than lower TF's.
Thanks for checking it out! I've been trading crypto for years and am just now beginning to publish my ideas, secret-sauce scripts and handy tools (like this one). If you enjoyed this indicator and would like to see more, a like and a follow is greatly appreciated 😁.

Vervoort SmoothingThis script has both the Triple Exponential Moving Average (TEMA) and zero lag sma written as functions. Both from Capturing Profit with Technical Analysis (24-25) by Sylvain Vervoort.
Best regards,
capam

Resampling Filter Pack [DW]This is an experimental study that calculates filter values at user defined sample rates.
This study is aimed to provide users with alternative functions for filtering price at custom sample rates.
First, source data is resampled using the desired rate and cycle offset. The highest possible rate is 1 bar per sample (BPS).
There are three resampling methods to choose from:
-> BPS - Resamples based on the number of bars.
-> Interval - Resamples based on time in multiples of current charting timeframe.
-> PA - Resamples based on changes in price action by a specified size. The PA algorithm in this script is derived from my Range Filter algorithm.
The range for PA method can be sized in points, pips, ticks, % of price, ATR, average change, and absolute quantity.
Then, the data is passed through one of my custom built filter functions designed to calculate filter values upon trigger conditions rather than bars.
In this study, these functions are used to calculate resampled prices based on bar rates, but they can be used and modified for a number of purposes.
The available conditional sampling filters in this study are:
-> Simple Moving Average (SMA)
-> Exponential Moving Average (EMA)
-> Zero Lag Exponential Moving Average (ZLEMA)
-> Double Exponential Moving Average (DEMA)
-> Rolling Moving Average (RMA)
-> Weighted Moving Average (WMA)
-> Hull Moving Average (HMA)
-> Exponentially Weighted Hull Moving Average (EWHMA)
-> Two Pole Butterworth Low Pass Filter (BLP)
-> Two Pole Gaussian Low Pass Filter (GLP)
-> Super Smoother Filter (SSF)
Downsampling is a powerful filtering approach that can be applied in numerous ways. However, it does suffer from a trade off, like most studies do.
Reducing the sample rate will completely eliminate certain levels of noise, at the cost of some spectral distortion. The lower your sample rate is, the more distortion you'll see.
With that being said, for analyzing trends, downsampling may prove to be one of your best friends!

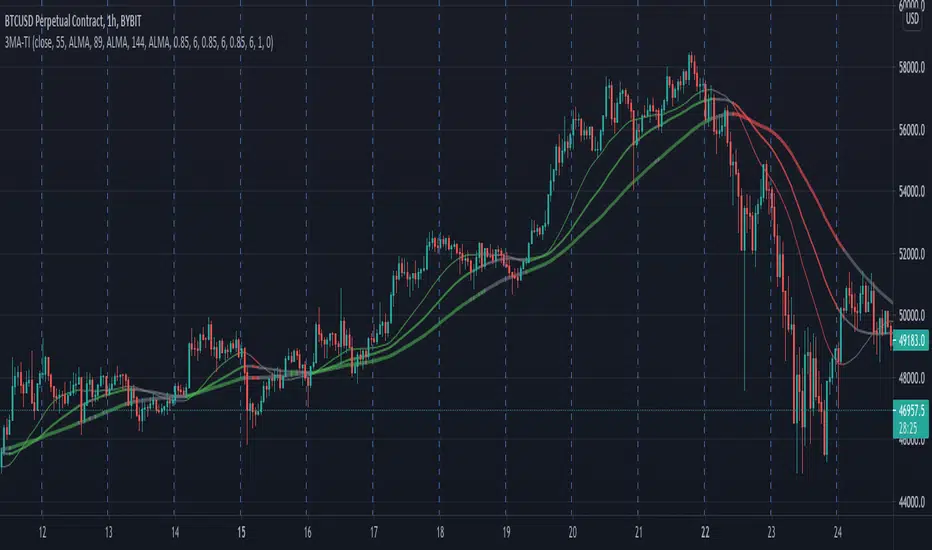
3 MA Trend IndicatorIt is a trend detector indicator, using 3 moving averages.
You can select different MA's and set the periods of them. If all 3 is increasing, the color will be green, if decreasing, the color will be red, gray otherwise.
It can be used for e.g. scalping.
Zero Lag Keltner ChannelsThis is Keltner Channelz (KC) with Zero Lag Moving Average (ZLMA as base). It is smoother and has less lag than the original (EMA/SMA) variant.
It also can be used as a trend indicator and trend confirmation indicator. The upper and lower bands are green if it is an up trend, and red if a down trend. If both have the same color it is a stronger trend.
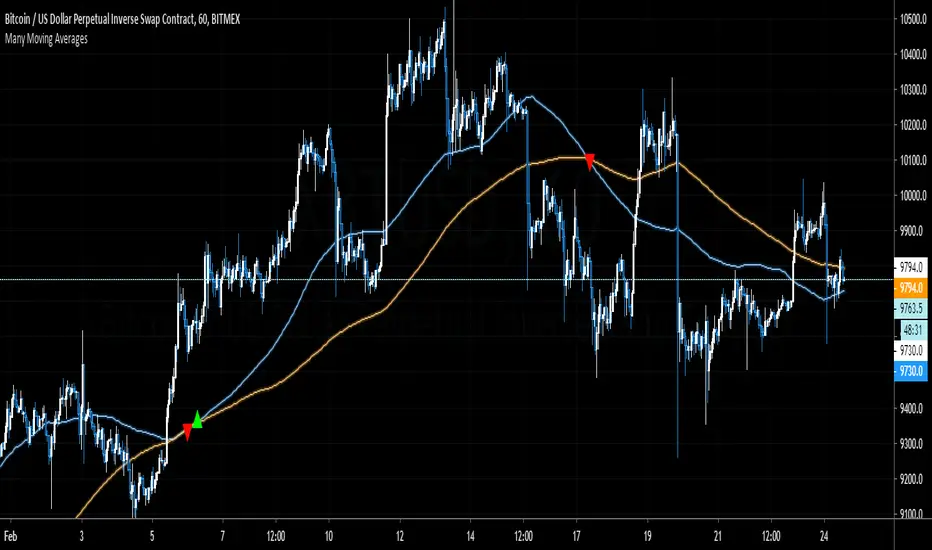
Many Moving AveragesThis script allows you to add two moving averages to a chart, where the type of moving average can be chosen from a collection of 15 different moving average algorithms. Each moving average can also have different lengths and crossovers/unders can be displayed and alerted on.
The supported moving average types are:
Simple Moving Average ( SMA )
Exponential Moving Average ( EMA )
Double Exponential Moving Average ( DEMA )
Triple Exponential Moving Average ( TEMA )
Weighted Moving Average ( WMA )
Volume Weighted Moving Average ( VWMA )
Smoothed Moving Average ( SMMA )
Hull Moving Average ( HMA )
Least Square Moving Average/Linear Regression ( LSMA )
Arnaud Legoux Moving Average ( ALMA )
Jurik Moving Average ( JMA )
Volatility Adjusted Moving Average ( VAMA )
Fractal Adaptive Moving Average ( FRAMA )
Zero-Lag Exponential Moving Average ( ZLEMA )
Kauman Adaptive Moving Average ( KAMA )
Many of the moving average algorithms were taken from other peoples' scripts. I'd like to thank the authors for making their code available.
JayRogers
Alex Orekhov (everget)
Alex Orekhov (everget)
Joris Duyck (JD)
nemozny
Shizaru
KobySK
Jurik Research and Consulting for inventing the JMA.
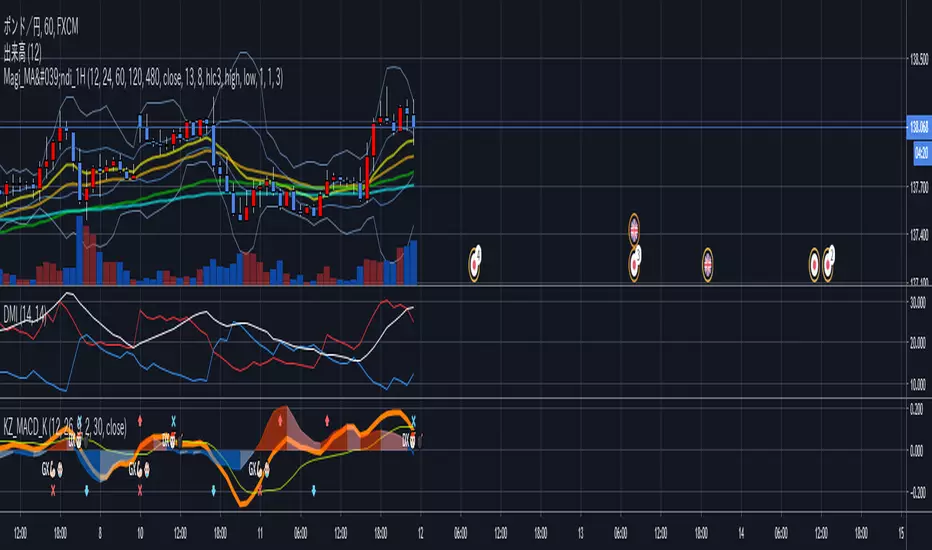
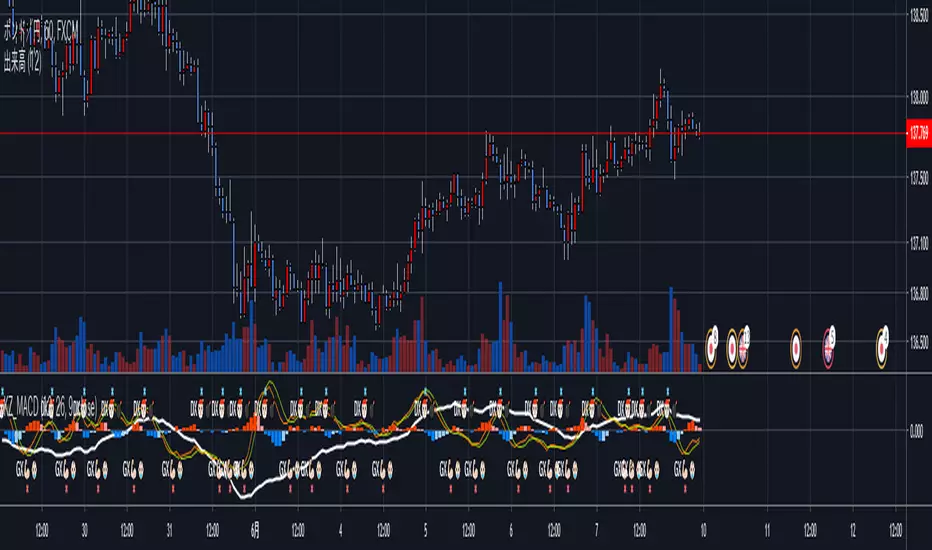
Koby's ZLEMA MACD and KAMA signalUsing zero lag ema for MACD line, and using KAMA for MACD's signal line.
Test version.
This has MACD and signal cross alert, and 0 line alert.
Zero Lag Exponential Moving AverageZero Lag Exponential Moving Average indicator script based on the original version by John Ehlers and Ric Way
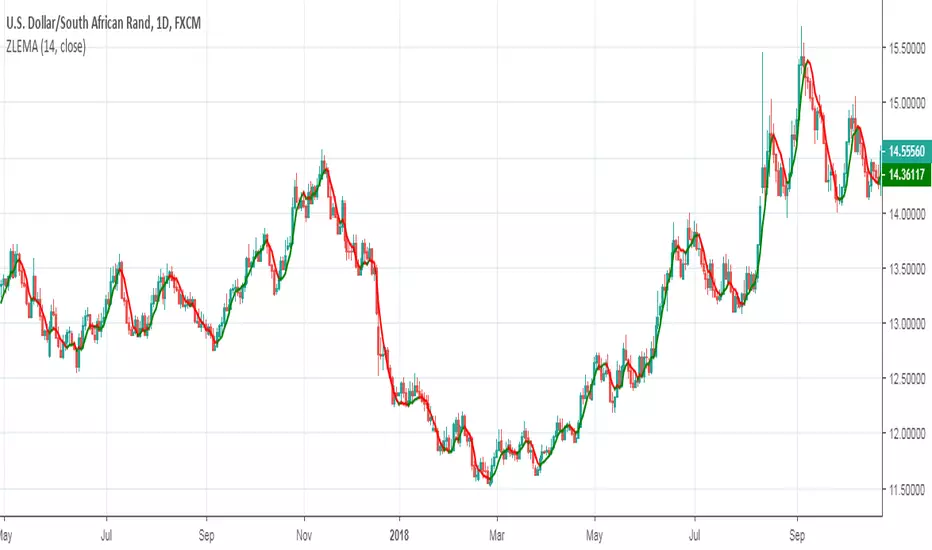
Zero Lag Exponential Moving Average (ZLEMA) The Zero lag exponential moving average (ZLEMA) indicator was created
by John Ehlers and Ric Way.
As is the case with the Double exponential moving average (DEMA) and
the Triple exponential moving average (TEMA) and as indicated by the
name, the aim is to eliminate the inherent lag associated to all trend
following indicators which average a price over time.

Moving Average RibbonThis is an extension of the Madrid Moving Average Ribbon public script to allow for different kinds of moving averages (the original allows only exponential and simple). Possible entries in the MA Type argument field are:
sma (simple moving average)
ema (exponential moving average)
wma (weighted moving average)
trima (triangular moving average)
zlema (zero-lag exponential moving average)
dema (double exponential moving average)
tema (triple exponential moving average)
hma (hull moving average)
If the argument given by the user does not match anything from the above list, it will default to ema.