Extended MacrosExtended Macro Times from XX:42 to XX:15.
These are the times to trade and when the Smart Money Reversal is likely to occur.
Zeussy

369 Swing Points369 Swing Points - Digital Root Time Analysis
This indicator combines swing point detection with digital root numerology applied to intraday timestamps, filtering for times that reduce to 3, 6, or 9.
Methodology:
The script uses pivot point detection to identify swing highs and lows, then calculates the digital root of the bar's timestamp. Digital root is calculated by recursively summing the digits of a number until a single digit remains (e.g., 13:45 = 1345 → 1+3+4+5 = 13 → 1+3 = 4). Only swing points occurring at times with digital roots of 3, 6, or 9 are displayed.
What Makes This Unique:
Unlike standard swing point indicators, this filters results based on time-based numerology. The multiple calculation modes allow testing different hypotheses: whether the full timestamp (HHMM), just the minutes (MM), or either produces significant patterns. This is particularly useful for traders exploring intraday cyclical patterns or time-based market theories, especially popular in swing trading communities that follow specific time cycles.
How It Works:
Detects swing highs/lows using configurable lookback periods
Extracts the timestamp from each swing point bar
Calculates digital root using selected time mode (Full Time, Minutes Only, or Both)
Displays only swings with DR of 3, 6, or 9
Includes timezone adjustment to match your local time
Optional real-time plotting to show potential swings before confirmation
Configuration:
Swing Length: Sensitivity of pivot detection (default: 2)
Digital Root Mode: Full Time (HHMM), Minutes Only (MM), or Both
Timezone Offset: Aligns displayed times with your chart's timezone
Label customization: Text size, color, spacing options
Real-time Plotting: Shows unconfirmed swings as they develop (with transparency)
Debug mode: View all swings with their digital roots for analysis
Usage:
Works on all intraday timeframes (1min to 4H). Adjust timezone offset to ensure accurate time display. Use debug mode to verify swing detection and see digital root calculations for all pivots. Enable "Highlight 369 Digital Root Bars" to see when current bar time has a 3/6/9 digital root.

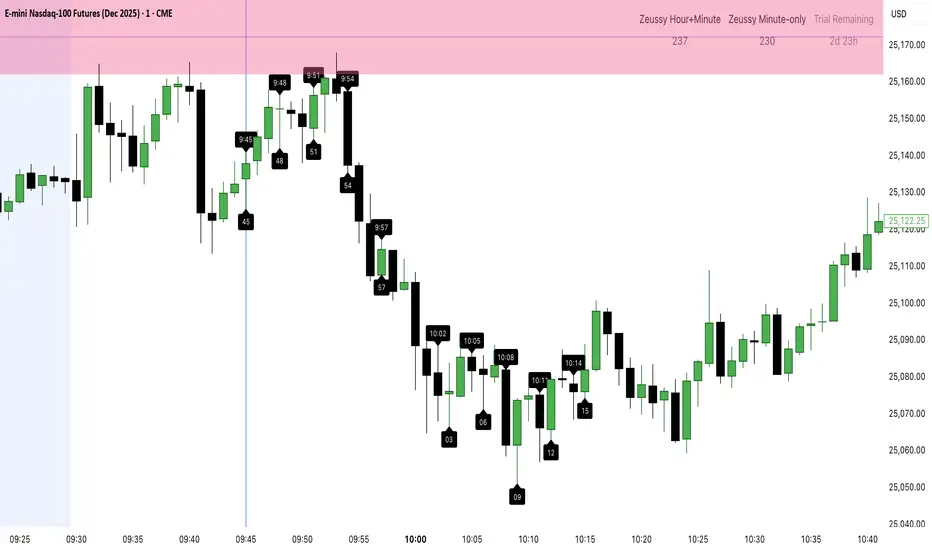
Zeussy 3-6-9 Indicator (NY) – Paid Trial - Trial VersionZeussy 3-6-9 Indicator (NY) – Trial Version
An innovative trading indicator based on the Zeussy 3-6-9 timing system, supporting New York time.
Key Features:
Dynamic Candlestick Colors: Clear coloring for bullish and bearish candles.
Zeussy Labels:
Hour+Minute labels for sums 3, 6, 9.
Minute-only labels for sums 3, 6, 9.
Vertical Line at Minute 45 to highlight key time points.
Daily Statistics: Counts of Zeussy Hour+Minute and Zeussy Minute-only occurrences.
3-Day Trial: All premium features are active automatically for 3 days from the first bar on any chart.
Countdown Timer: Shows remaining days and hours during the trial period.
After the trial expires: all premium features are disabled, and a red warning appears:
"Trial Expired! Please Purchase Paid Version"
Sound Alerts when Zeussy Labels appear (can be enabled/disabled).
Customizable Options: Candle colors, Zeussy Label colors, label size, show/hide trial text, show/hide table and lines.
💰 Purchase Full Version: $30. Contact me directly to buy a permanent license.
Tesla 3-6-9 Indicator (NY) – Free OnlyOverview
The Tesla 3-6-9 indicator detects key numeric patterns based on hour + minute or minute-only digit sums in New York time, highlighting the results directly on your chart with:
Colored candlesticks
🔺 Hour+Minute signals
🔻 Minute-only signals
Vertical line at minute 45
Daily Tesla statistics table (Paid Version)
This indicator is perfect for traders who want visual guidance for Tesla 3-6-9 patterns without manual calculations.
Features
Feature Free Version Paid Version
Minute-only Tesla signals 🔻 ✅ ✅
Hour+Minute Tesla signals 🔺 ❌ ✅
Candlestick coloring ✅ ✅ (customizable colors)
Vertical line at minute 45. ❌ ✅
Sound alerts ✅ ✅
Daily statistics table ❌ ✅
Symbol size & color customization. ✅ ✅
Ignore zero digits option ✅ ✅
How It Works
Minute-only sum: Adds digits of the current minute and reduces to 3, 6, or 9.
Hour + Minute sum: Adds digits of hour + minute, reduces to 3, 6, or 9.
Candle colors: Automatically changes color when Tesla patterns are detected.
Signals: 🔺 and 🔻 symbols appear above or below candles.
Vertical line: Marks minute 45 (Paid Version).
Daily stats table: Tracks Tesla signals per day (Paid Version).
Customizable Settings
Setting Description
Show 🔺 Hour+Minute Symbols Toggle visibility of Hour+Minute signals
Show 🔻 Minute-only Symbols Toggle visibility of Minute-only signals
Symbol Size Adjust size of 🔺 and 🔻 symbols
Candlestick Colors Customize bullish and bearish candle colors
Tesla Colors Set custom colors for Hour+Minute and Minute-only candles
Enable Sound Alerts Enable/disable sound alerts
Show Vertical Line at Minute 45 Toggle vertical line visibility
Line Color & Width Customize line appearance
Hour+Minute priority Determines if Hour+Minute signals override Minute-only visually
Installation
Open TradingView
Click Indicators → Invite-Only Scripts
Search for Tesla 3-6-9 Indicator (NY)
Add it to your chart and configure settings
Subscription & Pricing Suggestions
Free Version: Access to minute-only signals 🔻 as a teaser
Paid Version: Full feature set (🔺 signals, vertical line, daily stats)
Monthly Subscription: $10/month
Offer trial period to attract new users
Usage Tips
Best used on 1-minute or 5-minute charts
Works with any market symbol
Track patterns visually without manual calculation
Use the daily statistics table to analyze Tesla signal frequency

Smart Money Time (SMT)SMT Divergence – 90m / 30m / 10m (Prev-Cycle, Real-Time, Trailing)
Purpose:
This indicator finds SMT (Smart Money Technique) divergences between two related markets (e.g., CME_MINI:NQ1! vs CME_MINI:ES1! ). It does this per 90m/30m/10m cycles and only compares the current cycle to the immediately previous cycle —never older. It supports three cycle granularities:
90-minute cycles (9 blocks from 02:30–16:00 NY time)
30-minute sub-cycles (27 blocks)
10-minute sub-cycles (81 blocks; exactly 3 per 30-minute cycle)
For each cycle, the script tracks each symbol’s extreme (highest high for potential bearish SMT, lowest low for potential bullish SMT). When the leader sets a new extreme vs its own previous cycle while the lagger fails to do so vs its previous cycle, an SMT divergence is formed and plotted on the chart in real time. Lines trail as price makes new extremes within the same cycle.
What you’ll see on the chart:
A line from the previous cycle’s extreme to the current cycle’s extreme on the symbol pane where the indicator is applied (Primary A).
An optional text label at the current extreme (e.g., “90m SMT”, “30m SMT”, “10m SMT”).
Lines update (“trail”) as the current cycle goes on. When a new cycle begins, tracking resets for that cycle.
Default styling (editable):
90m SMT: solid, width 1, black
30m SMT: solid, width 1, black
10m SMT: dotted, width 1, black
You can toggle the text on/off and change width, style, and colors separately for 90m, 30m, and 10m.
Signals (definitions)
Bearish SMT: One market makes a Higher High vs its own previous cycle, while the other fails to make a Higher High vs its previous cycle.
Bullish SMT: One market makes a Lower Low vs its own previous cycle, while the other fails to make a Lower Low vs its previous cycle.
The line is drawn on Primary A by default.
Settings (explained)
Symbols
Primary Symbol A – the chart’s “leader/lagger” pane the script draws on.
Comparison Symbol B – the second market used for SMT checks.
Detection toggles
Detect SMT: 90m / 30m / 10m – turn on/off detection for each timeframe.
Note: The script always compares current cycle ↔ previous cycle only.
Validate candle direction
When enabled, the bar that makes the new extreme must also close in the confirming direction on that same market:
Bearish SMT: the bar that made the new Higher High must be a down close (close < open).
Bullish SMT: the bar that made the new Lower Low must be an up close (close > open).
This filter removes many “wick-only” probes and reduces false positives.
Turn off if you prefer to register SMTs on any intrabar extreme, regardless of bar close.
Delete SMT when invalidated
After an SMT forms, if the lagger later breaks the previous extreme it initially failed to break, the divergence is considered invalid and the script deletes the line and its label. (An “SMT invalidated” alert can fire if alerts are enabled.)
Enable alerts
Fires on SMT formed (separate messages for 90m/30m/10m and bullish/bearish) and on SMT invalidated.
To use, click Create Alert on the indicator and choose “Any alert() function call”. Use “Once per bar” (or per bar close) to taste.
Appearance – per timeframe (90m / 30m / 10m)
Bullish/Bearish colors, Line width, Line style, Show text (toggle subtitle label).
Text Options
Text color, Text size, Text offset (vertical spacing from the extreme).
How to use
Add to chart and select two related markets, e.g., NQ (A) vs ES (B).
Choose which cycles to monitor (90m / 30m / 10m).
Optionally enable Validate candle direction to demand a confirming close on the bar that made the extreme.
Watch for plotted SMTs:
Bearish SMT (HH vs no HH) often signals potential weakness
Bullish SMT (LL vs no LL) often signals potential strength
Use SMTs as context/confluence—e.g., near session highs/lows, liquidity pools, PD arrays, or your own levels. Combine with structure, order flow, and risk rules.
Turn on alerts to be notified when SMTs form or are invalidated in real time.
Notes & behavior
New-York session timing: Cycles are fixed windows in America/New_York and automatically handle DST.
Real-time & trailing: Lines trail to the most recent extreme within the same cycle but there’s no look-ahead across cycles.
No repaint across cycles: Each signal is strictly current cycle vs previous cycle.
Cleanup: On invalidation the script deletes the label first, then the line, preventing orphan labels.
Tips
10m SMTs are more frequent/noisier; 90m are fewer but more meaningful. Many traders look for multi-frame agreement (e.g., a 30m SMT aligning with a fresh 10m SMT).
If you want fewer signals, keep Validate candle direction on; if you want maximum sensitivity, turn it off.
Disclaimer: Educational use only. Markets are risky; do your own research and manage risk responsibly.

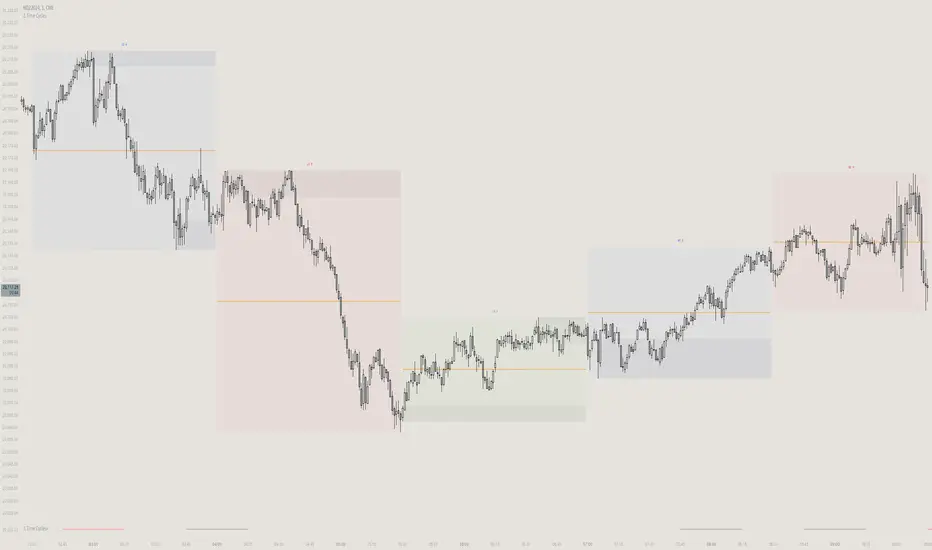
itradesize /\ Time Cycles x Zeussy supplementaryThis is a supplementary script to my previous itradesize /\ Time Cycles x Zeussy script. It should be displayed in a new pane.
This script will display the 30 and 90 AMD Time Cycles, along with the Asia, London, and New York AM & PM sessions in a new pane, based on the times taught by Zeussy.
You have the option to customize which cycles you would like to display, as well as the arrangement of the cycles based on the location of the pane (above or below the current chart).
The script can also be used for backtesting; just uncheck the 'Draw Today's Only' option.
Session timings are as follows:
Asia: 20:00 - 00:00
London: 02:30 - 07:00
NY AM: 07:00 - 11:30
NY PM: 11:30 - 16:00
London Cycles:
- 02:30 - 04:00
- 04:00 - 05:30
- 05:30 - 07:00
AM Cycles:
- 07:00 - 08:30
- 08:30 - 10:00
- 10:00 - 11:30
PM Cycles:
- 11:30 - 13:00
- 13:00 - 14:30
- 14:30 - 16:00
itradesize /\ Time Cycles x ZeussyI created this script based on Zeussy's & TOTK time cycle tweets.
The base 90-minute cycle starts at 2:30 AM NY time. For the best outcome, trade only during the New York AM & PM cycles. If you are a London trader, use mainly the Asian high and low instead of those 90-minute cycles as the algorithm mostly refers to them instead of the 90M cycles high or low.
In the current time cycle, we use the high and low of the previous cycle(s) to determine order flow.
During the current time cycle, IPDA refers to the previous cycle(s) as high or low. How the price reacts to these price levels is crucial for measuring order flow.
Every turning point in the market is timed and predetermined beforehand. The importance of timing can be seen by glancing at the history of the charts.
To measure order flow, we look for the following signs of reversal or continuation:
- If the price was bullish but does not find support at the previous cycle's high after breaking above it, it is the first warning sign that the order flow is potentially changing.
- If the price was bearish but does not find resistance at the previous cycle's low after breaking below it, it is the first warning sign that the order flow is potentially changing.
- If the price is bullish, then it should find support at the previous cycle's high after breaking above it.
- If the price is bearish, then it should find support at the previous cycle's low after breaking below it.
Each cycle has its Accumulation , Manipulation , and Distribution (AMD) characteristics within the larger sessions.
Even smaller cycles have these characteristics too. You can divide them further or add them up to get a more complex picture.
The indicator primarily shows the 90-minute cycles, but you can also view the multiples of 90-minute cycles to get a higher 270-minute picture. You can even divide them further into 30-minute cycles. (These 30-minute cycles can also be divided into 10-minute cycles.)
The AM sessions are from:
- 07:00 - 8:30
- 8:30 - 10:00
- 10:00 - 11:30
The PM sessions are from:
- 11:30 - 13:00
- 13:00 - 14:30
- 14:30 - 16:00
Regarding the features of the indicator, you can show the cycles as dividers or use boxes to highlight them.
The indicator also comes with a pivot high & low for the 90-minute cycles, which means the script automatically lengthens the high or low of the former 90-minute cycle until it's taken. If it has not been taken until the 90-minute cycle ends, it stops drawing.
