Crypto Gann Channel Strategy (Long Bias, fixed)This is Gann Strategy Cody with Long Bias. Please try and let me know if can be improved. Pine Script® Strategievon vlasnik43
RSI-EMA-Crossing with Donchian-Stop-LossThe Donchian RSI Indicator is a visual tool that combines momentum and trend analysis to identify high-quality long opportunities based on RSI crossovers, price action, and Donchian channel dynamics. How It Works Momentum Signal: A bullish RSI crossover is detected when the RSI crosses above its moving average. Trend Filter: A signal is only valid if the crossover occurs while the price is above its moving average – filtering out entries against the prevailing trend. Signal Candle: The high of the crossover candle is stored. Entry Trigger: A valid signal occurs when a later candle closes above that signal high. Stop-Loss (Visual Only) The lower band of the Donchian Channel acts as a visual reference for a dynamic stop-loss level. Features Customizable RSI, Donchian Channel, and moving average lengths Selectable MA types: SMA, EMA, WMA, VWMA, HMA Signal candle highlighted (yellow background) Entry points labeled on the chart Price MA and Donchian Channel plotted Trend filter improves signal quality by confirming upward bias Use Case Designed for swing and position traders Optimized for use on daily or 4H charts Pine Script® Indikatorvon Kahael66
Stock vs Custom Symbol OutperformanceStock vs Custom Symbol Outperformance" is a powerful technical analysis indicator designed to help traders and investors gauge the relative performance of a stock against a selected benchmark symbol. This tool enables users to easily visualize how a stock is performing in comparison to another asset, such as an index or another stock. Key Features: Custom Symbol Comparison: Input any symbol to compare against the stock of interest, allowing for flexible analysis tailored to specific market conditions. Outperformance Calculation: The indicator calculates the percentage change in price for both the stock and the selected benchmark, providing a clear view of relative performance. Moving Average Smoothing: A customizable moving average smooths the outperformance data, helping to identify trends and reduce noise in the signals. Threshold Lines: Set upper and lower threshold lines to visualize significant levels of outperformance or underperformance, aiding in decision-making. Dynamic Color Coding: The outperformance bars are color-coded—green indicates that the stock is outperforming the benchmark, while red indicates underperformance. How to Use: Select a Benchmark: Use the input field to choose the symbol against which you want to compare the stock. Adjust Parameters: Modify the moving average length and set your desired thresholds for easier identification of performance metrics. Interpret Results: Analyze the plot for insights into the stock's performance relative to the benchmark, with the moving average providing additional context for trends. This indicator is ideal for traders looking to refine their strategies by understanding how individual stocks measure up against key benchmarks in the market. Pine Script® Indikatorvon navneet21435
PharshK RSI and Zigzag with H/LIt is with RSI level and Zigzag Pattern that Market goes on Maximum level and Lower Level And it is also Showing High and Law Level of last Moving Candle so it is easy to entry and HoldPine Script® Indikatorvon pharshk66300
PharshK RSI and Zigzag with H/LIt is with RSI level and Zigzag Pattern that Market goes on Maximum level and Lower Level And it is also Showing High and Law Level of last Moving Candle so it is easy to entry and HoldPine Script® Indikatorvon pharshk33174
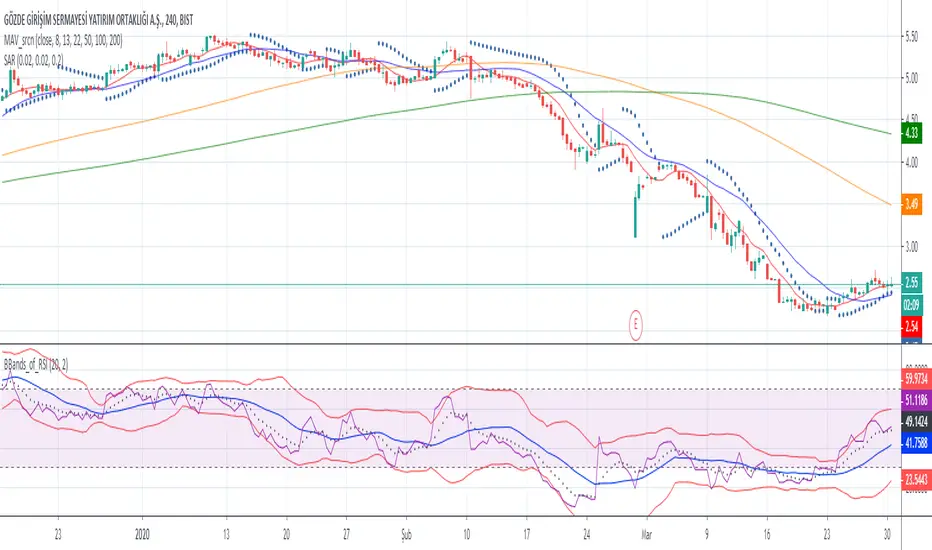
Bollinger Bands of RSIwith this script you can follow ema8 of RSI and also SMA20 of RSI with ∓ 2 standart deviationPine Script® Indikatorvon srcnstldr33298
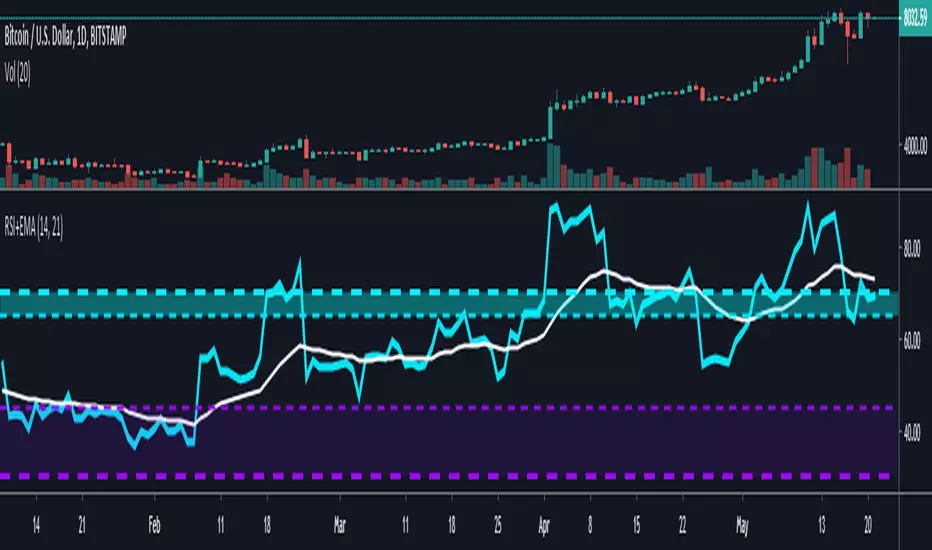
RSI + EMA with Multiple ZonesThis is your traditional RSI chart but with a few modifications I added an extra zone parameter that you can specify with its own color and line customization. There is an EMA that tracks the RSI as well.Pine Script® Indikatorvon Coin_Savvvy22124
RSI AND SMOOTHED STOCH RSI TOGETHERi dont know pine script but here i used some free ones and merged them and modified some especially smoothed stoch rsi is Good to decide when buy coz i modified it and when fast K value is over D value it changes color visually better this way also rsi is shown as area o histogram but if u dont like u can change to line for stoch rsi i unclick xtrigger (d value) for better appearance Pine Script® Indikatorvon Mlnklkm44180
Fisher Transform with Up/Down colours - squattter - V2Colours change faster now using the white line as reference rather than the bars.Pine Script® Indikatorvon squattter104
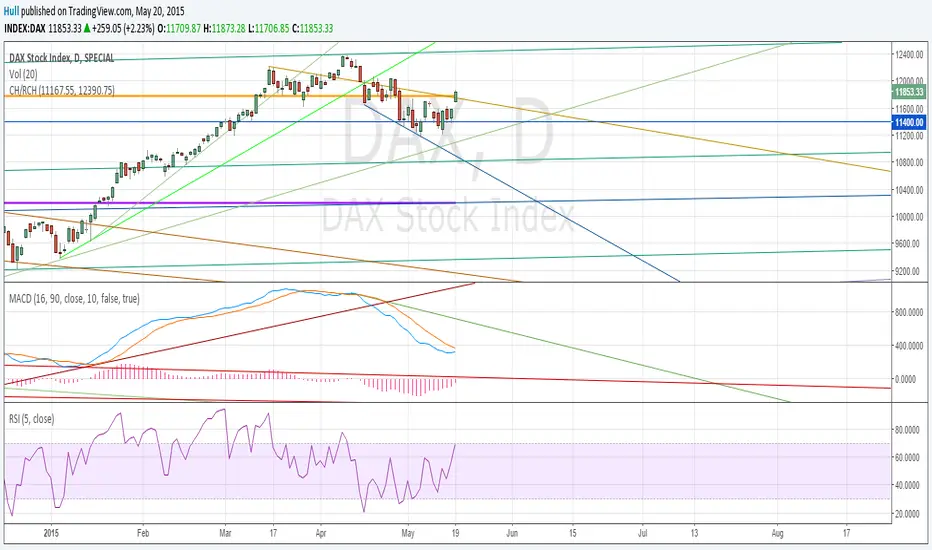
Code for Cup With Handle calculations (using Pine)Cup with Handle formation calculations using Pine. First of all, ignore all other lines in the example chart except the two FAT lines. The two fat lines are the ones that define the Cup With handle or in the example chart: a Reversed Cup With Handle. Note: Handle does not always develop and sometimes the final target price is reached without forming any handle. This script can calculate both Cup With Handle ( CH ) and Reversed Cup With Handle ( RCH ). Just order the input values accordingly. For more information about Cup With Handle, use google: www.google.se The script need two input parameters : The highest price in the Cup formation and the lowest price in the cup formation or vice versa for the Reversed Cup formation. Best regards, /Hull, 2015.05.20.16:31 Pine Script® Indikatorvon R2D2B2C2359