Portfolio Monitor - DolphinTradeBot1️⃣ Overview
▪️This indicator unifies the value of all your investments—whether stocks, currencies, or cryptocurrencies—in your chosen currency. This tool not only provides a clear snapshot of your overall portfolio performance but also highlights the individual growth of each asset with intuitive visualizations and an easy-to-understand performance report.
2️⃣ What sets this indicator apart
▪️is its ability to convert values from various currency pairs into any currency you choose. This means you can monitor your portfolio's performance against any currency pair you prefer, offering a flexible and comprehensive view of your investments.
3️⃣ How Is It Work ?
🔍The indicator can be analyzed under two main categories: visual representations and tables.
1- Visual representations ;
The indicator includes three different types of lines:
1. 1 - Reference Line → This represents the cost of all assets we hold, based on the selected date.
1. 2 - Total Assets Line → Displays the real-time value of all assets in our possession, including cash value, in the selected trading pair.
The area between the reference line is filled with green and red. The section above the reference line is represented in green, while the section below is shown in red.
1. 3 - Performance Lines → These visualize the performance of the assets, starting from the reference line and taking into account their weights in the portfolio. (Note: The lines are scaled for visualization purposes, so their absolute values should not be considered.)
"The names of the lines are shown in the image below."⤵️
2- Tables
The indicator includes three different types of tables:
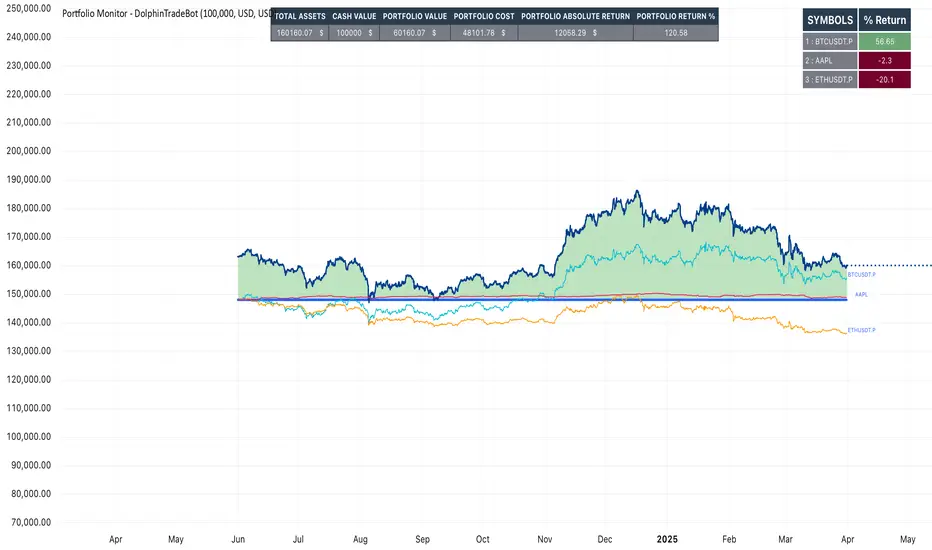
2. 1 - Analysis Table : It provides a superficial overview of wallet statistics and values.
▪️TOTAL ASSETS → The current equivalent of all assets in the target currency
▪️CASH VALUE → The current value of the amount "Cash Value", in the target currency.
▪️PORTFOLIO VALUE → The total value of assets excluding Cash, in the target currency.
▪️POSTFOLIO COST → The cost of assets excluding Cash, in the target currency.
▪️PORTFOLIO ABSOLUTE RETURN → It shows the profit or loss relative to the cost of assets
▪️PORTFOLIO RETURN % →It shows the profit or loss relative to the cost of assets on a percentage basis
2. 2 - Performance Table : It displays the names of assets excluding Cash and their profit amounts, sorted from highest to lowest profit. If "Show as Percentage" is selected in the settings, it shows the percentage profit or loss relative to the cost. Profits are represented in green, while losses are represented in red.
"You can see the visual showing the tables below"⤵️
4️⃣How to Use ?
1- Choose the date on which the visualization will begin (📌The start date only affects the exchange rate used for calculating the reference line in the target currency.)
2- If you have cash holdings, enter the amount and specify the currency.
3- Select the currency in which your portfolio value will be displayed.(Default value is USD)
4- To set up your portfolio;
SYMBOLS - QUANTITY - PURCHASE PRICE
Enter the symbols of your assets - the number of units you hold - and their cost levels.
5- If you have cash, be sure to include your cash balance. If you also hold other currencies, enter them as separate assets with their corresponding quantities and purchase prices.
6- If you want to see the percentage returns of the assets in the performance table relative to their cost, select the "Show as Percent" option.
7- If you want to see the performance visuals of the assets, click on the "Show Asset Performance" option.
You can find an image of the settings section where the numbers above are used as references below.⤵️
📌 NOTE → By default, a few assets and their values have been pre-added in the initial settings. This is to ensure that you don’t see an empty screen when adding the indicator to the chart. Please remember to enter your own assets and values. The default settings are only provided as an example.
Wallet
Crypto Wallets Profitability & Performance [LuxAlgo]The Crypto Wallets Profitability & Performance indicator provides a comprehensive view of the financial status of cryptocurrency wallets by leveraging on-chain data from IntoTheBlock. It measures the percentage of wallets profiting, losing, or breaking even based on current market prices.
Additionally, it offers performance metrics across different timeframes, enabling traders to better assess market conditions.
This information can be crucial for understanding market sentiment and making informed trading decisions.
🔶 USAGE
🔹 Wallets Profitability
This indicator is designed to help traders and analysts evaluate the profitability of cryptocurrency wallets in real-time. It aggregates data gathered from the blockchain on the number of wallets that are in profit, loss, or breaking even and presents it visually on the chart.
Breaking even line demonstrates how realized gains and losses have changed, while the profit and the loss monitor unrealized gains and losses.
The signal line helps traders by providing a smoothed average and highlighting areas relative to profiting and losing levels. This makes it easier to identify and confirm trading momentum, assess strength, and filter out market noise.
🔹 Profitability Meter
The Profitability Meter is an alternative display that visually represents the percentage of wallets that are profiting, losing, or breaking even.
🔹 Performance
The script provides a view of the financial health of cryptocurrency wallets, showing the percentage of wallets in profit, loss, or breaking even. By combining these metrics with performance data across various timeframes, traders can gain valuable insights into overall wallet performance, assess trend strength, and identify potential market reversals.
🔹 Dashboard
The dashboard presents a consolidated view of key statistics. It allows traders to quickly assess the overall financial health of wallets, monitor trend strength, and gauge market conditions.
🔶 DETAILS
🔹 The Chart Occupation Option
The chart occupation option adjusts the occupation percentage of the chart to balance the visibility of the indicator.
🔹 The Height in Performance Options
Crypto markets often experience significant volatility, leading to rapid and substantial gains or losses. Hence, plotting performance graphs on top of the chart alongside other indicators can result in a cluttered display. The height option allows you to adjust the plotting for balanced visibility, ensuring a clearer and more organized chart.
🔶 SETTINGS
The script offers a range of customizable settings to tailor the analysis to your trading needs.
Chart Occupation %: Adjust the occupation percentage of the chart to balance the visibility of the indicator.
🔹 Profiting Wallets
Profiting Percentage: Toggle to display the percentage of wallets in profit.
Smoothing: Adjust the smoothing period for the profiting percentage line.
Signal Line: Choose a signal line type (SMA, EMA, RMA, or None) to overlay on the profiting percentage.
🔹 Losing Wallets
Losing Percentage: Toggle to display the percentage of wallets in loss.
Smoothing: Adjust the smoothing period for the losing percentage line.
Signal Line: Choose a signal line type (SMA, EMA, RMA, or None) to overlay on the losing percentage.
🔹 Breaking Even Wallets
Breaking-Even Percentage: Toggle to display the percentage of wallets breaking even.
Smoothing: Adjust the smoothing period for the breaking-even percentage line.
🔹 Profitability Meter
Profitability Meter: Enable or disable the meter display, set its width, and adjust the offset.
🔹 Performance
Performance Metrics: Choose the timeframe for performance metrics (Day to Date, Week to Date, etc.).
Height: Adjust the height of the chart visuals to balance the visibility of the indicator.
🔹 Dashboard
Block Profitability Stats: Toggle the display of profitability stats.
Performance Stats: Toggle the display of performance stats.
Dashboard Size and Position: Customize the size and position of the performance dashboard on the chart.
🔶 RELATED SCRIPTS
Market-Sentiment-Technicals
Multi-Chart-Widget

Big Whale Purchases and SalesBig Whale Purchases and Sales - plots big whale transactions on your chart!
People that hold more than 1% of a crypto currencies circulating supply are considered whales and have a huge influence on price, not just because they can move the market with their huge transactions, but also because other traders often track their wallets and follow their example. Taking a look at whale holdings, one can see why whale worship is so common in crypto: While Bitcoin has a relatively low whale concentration, many of the Top 100 Cryptocurrencies have whales control 60% or more of their circulating supply.
Integrating IntoTheBlock data, this script plots the transactions of these whales and, in strategy mode, copy trades them.
Features:
Strategy Mode: Switches the script between an indicator and a strategy.
Standard Deviations: The number of Standard Deviations that a transaction needs to surpass to be considered worth plotting. Setting this to 0 will show all whale transactions, higher settings will only show the biggest transactions.
Blockchain: The Chain on which Whale activity is tracked.

BTC Profitable Wallets StrategyBTC Profitable Wallets Strategy - plots the percentage of profitable BTC wallets and places long orders when the profitable wallet share crosses above 50%, historically a very accurate point to catch the next Bull Run early.
The only setting is a smoothing option using the Moving Average method and length of your choice.
On Chain Data is queried from IntoTheBlock.
This is a 'HODL' strategy, with no exit given. If you'd like to see the historical performance check the Open Profit or place a sell order at the current date.

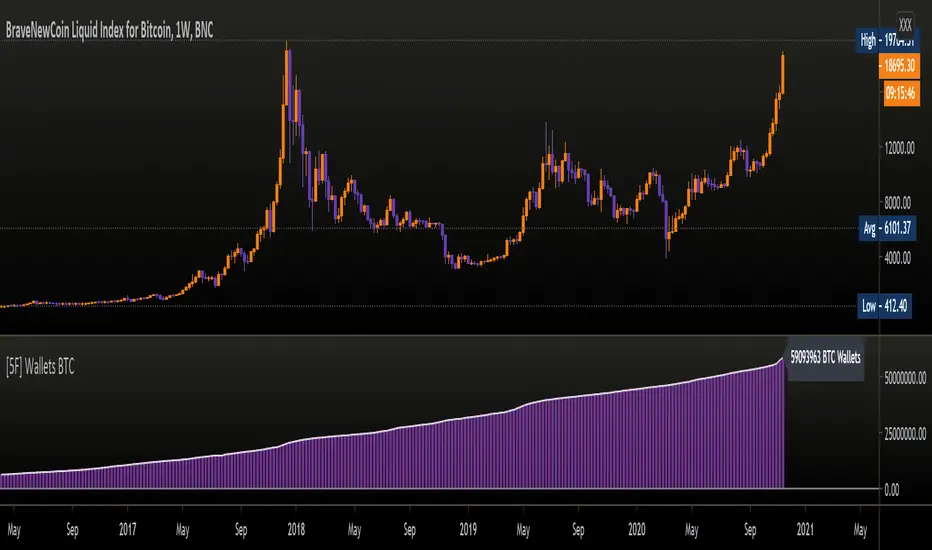
[5F ] Number of Bitcoin wallets-═════════════════════════-
This is a simple script that displays the total number of Bitcoins wallets based on the data provided by Quandl.
Use it in dayli resolution minimum
Refresh every day
Thanks to all Pinecoders who share their work with the community.
-═════════════════════════-
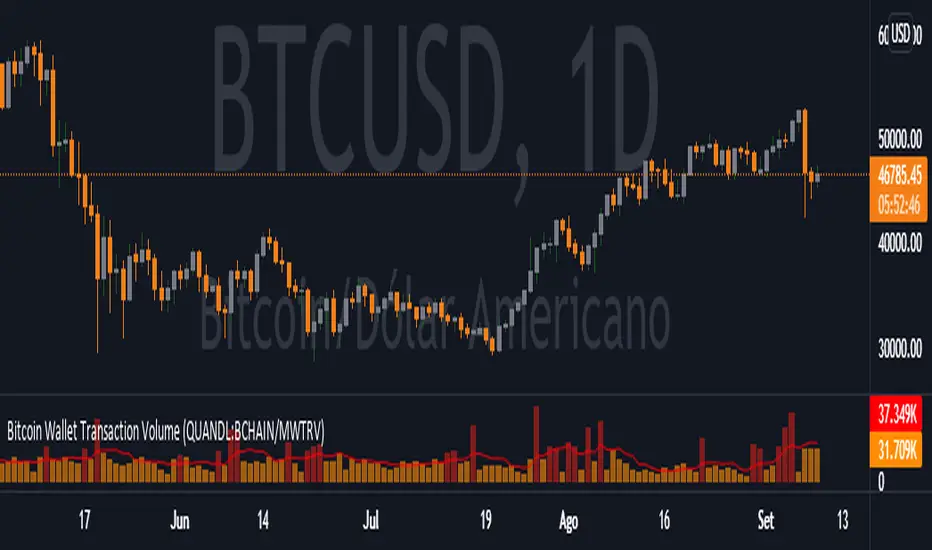
Bitcoin Wallet Transaction Volume (QUANDL:BCHAIN/MWTRV)Simple script that graphically represents the Bitcoin Wallet Transaction Volume .
Blockchain data made available at QUANDL .
Its logic is simple, search the data in the QUANDL database and plot it on the chart.