zibi fib3This is major update to Zibifi2 with addition of vwma fibs in order to remove issue that can happen with regular daily fibs (they sometime send bad signals)
in this version the addition will help to eliminate that effect
major buy points in green and red
minor buy and sell points are in lime and orange
have fun
Volume Weighted Moving Average (VWMA)

Fib,Guppy Multiple MA(FGMMA)(A/D & Volume Weight,SMA,EMA)[cI8DH]Features:
- 3 + 12 MAs (12 is chosen because Guppy has 12 MAs)
- MA types can be set to Simple, Exponential, Weighted, and Smoothed
- Volume weight can be applied to all available MAs (the built-in VWMA uses Simple MA)
- It is possible to count in only effective portions of the volume in the equation by using Accum/Dist Volume Weight
- Secondary smoothing (useful when volume weight is enabled)
- Predefined MA sets based on Fibonacci sequence (2,3,5,8,.., 377), Guppy (3,5,8,10,12,15 &30,35,40,45,50,60), and cI8DH (2,3,5,8,12,17 & 30,34,39,45,52,60)
Recommended settings:
- hlc3 as input source captures all the essential information encapsulated in a candle. I'd use hlc3 as the default option. In uptrend, "low" and in downtrend, "high" might give more relevant results when using MAs for structural analysis of a market. For commonly used MAs (EMA20, SMA50,100,200), "close" should be used due to their self-fulfilling prophecy effect.
- When you have volume weight above 0, you may want to use secondary smoothing.
- Try not to use Simple MA for smaller lengths (below 20). Sharp changes in the past (right before the period specified by the length) will affect the current value of MA dramatically leading to confusion.
- I am using the first 3 MAs for SMA 50,100,200. You can disable them from the MA type selector all at once when using Fib or Guppy ribbons.
MA-based analysis:
There are different ways of structuring a market. Geometrical (trend lines, channels, fans, patterns, etc) and Fib retracement-based structuring is very common among traders. MAs give an alternative way of analyzing markets. MA ribbons such as Guppy (6 slow and 6 fast-moving MAs) are popular for analyzing market flow. IMO default Guppy sets are a bit random as the numbers do not have an elegant sequence. So I proposed my sets based on increasing sequene spacing (+1). These two MA ribbons are good for market flow analysis but the spacing of the MAs are not ideal for structuring a market. Ribbons based on the Fib sequence is a better choice for structuring a market. This is the equivalent of Fib channels but in a more dynamic form. Among other things, MA Fib ribbon can be used to assess market momentum and to compare different stages of a market. Here are two "educational-only" examples:
Notes:
- Smoothed MA with length L = Exponential MA with length 2*L-1
- Read the background section in my ADP indicator to understand how A/D Volume is calculated

Volatility BalanceThis "Volatility Balance" indicator measures volatility from a different perspective.
It plots both an upside (green) and downside (red) volatility rating as well as a histogram depicting either the difference between the two or the two combined.
First, it calculates the ratio of the candle body (open to close) in relation to the entire candle range (high - low). This is the "candle body size ratio".
Secondly, it calculates the "dominance ratio" of the upside volatility (close - low) or downside volatility (high - close), in relation to the entire candle range (high - low)
Thirdly, it then uses the above values to derive the upside and downside power.
The upside and downside powers are calculated by multiplying the "candle body size ratio" to the upside or downside "dominance ratio" and then to the entire candle range.
It then divides this value by the close of the candle to normalize the overall value. After which it then multiplies this final value by 100, to get a percentage value between 0 - 100%.
It then averages the upside or downside "power value", using a volume-weighted moving average with the averaging period initially set to 7 periods, but this can be altered in the format settings.
The volatility difference or volatility size is displayed as a histogram style behind the green and red upside and downside power lines (depending on which value the user chooses), via an option in the format settings.
The volatility difference is the upside minus the downside and the volatility size is the upside and downside added together.
In case the user wishes to see EACH candle's power value before it has been averaged with volume, there is an option in the format settings to show each candle's upside or downside "power". If this method is chosen, the histogram will be hidden. There are also various check boxes, in case the user wishes to hide any of the plotted values.
The volatility size can determine how much energy has been behind the change in price over the period measured.
The volatility difference can determine how much upwards or downward energy is present within the period measured, in other words, the possible direction.
The use of the candle body ratio helps to determine the balance between upwards and downwards energy. If it is small, then it implies that there is more of a balance between buyers and sellers and therefore less volatility, as the price hasn't moved as much than if the body of the candle was larger. Smaller values indicate that price may not move as much and therefore lock up your funds longer until price starts to move again.
The use of a volume-weighted moving average helps to give higher volume periods more significance towards a possible price shift.
---------------------------------------------------------------------------------------------------------------------------
This indicator was originally inspired by the Profit Trailer Feeder add-on and it's volatility groupings.
If you don't already have the Profit Trailer Feeder add-on to the Profit Trailer software, and you have now decided to get it, please help me out and use my affiliate link below. It won't cost you any extra, but it helps keep the lights on, so I can create more of these indicators.
Kindest Regards
Created 2018 - by @Squiggles#8806
LTC Tip Jar: LX4bUBdjiRPsagUbZoAczSGgDC4YqTJL7w
Profit Trailer Feeder affiliate link: cryptoprofitbot.com

VOLUME WEIGHTED Guppy Multiple Moving Average名前のとおり
GMMAの説明は自分でお探しくだいさい
As the name implies
Please explain GMMA by yourself

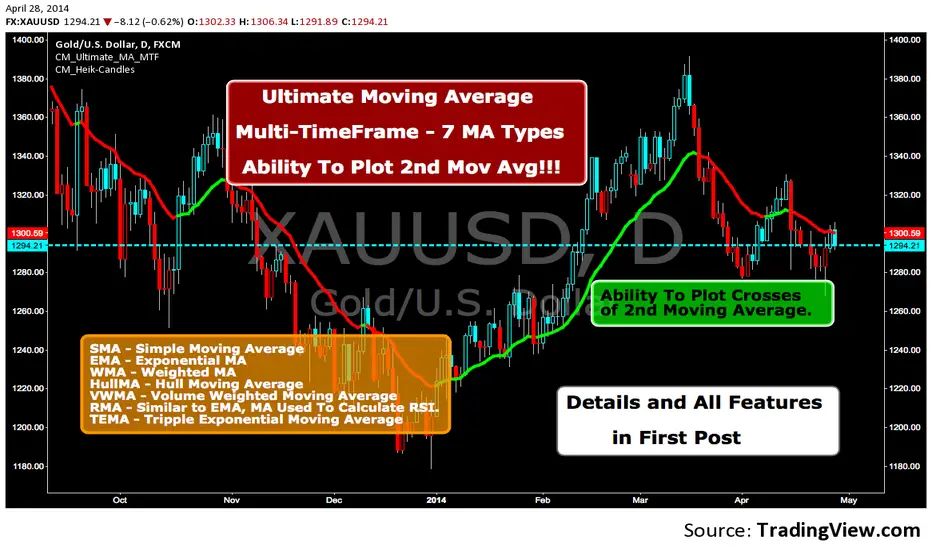
Ultimate 'Multi-Timeframe' Multi-AveragesPlots different kinds of averages (EMA, SMA, SMMA, WMA, VWMA) referred to a fixed timeframe/period indipendent from the one that you are watching (example: plot daily EMA on the 4h chart).
Highlights the crossing of averages.
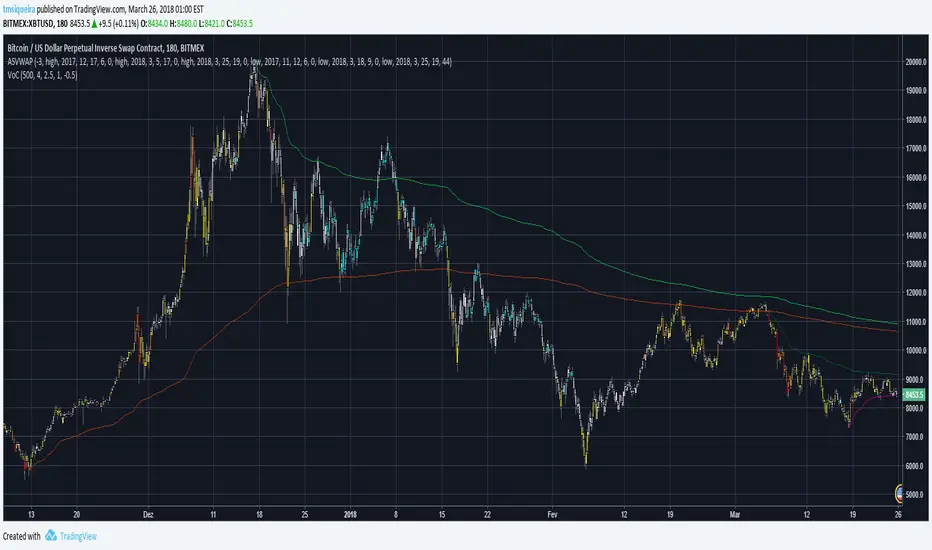
Adjustable Starting VWAPIn this script it's possible adjust the start where the VWAP (technically is a VWMA) starts to calculate.
Use this to try to show where is the suport and resistance.
I coded 6 lines.
Use low sources for suport.
Use high sources for resistance.
Elastic Volume Weighted Moving AverageElastic Volume Weighted Moving Average indicator script. This indicator was originally developed by Christian P. Fries (Technical Analysis of Stocks & Commodities, June 2001).

Volume Weighted MACD (VWMA, 4 Color, Color-blind Friendly)MACD built out of two Volume Weighted Moving Average (VWMA) lines of different periods. The signal line is still an EMA of the MACD line, just like with the normal MACD .
Colors are picked to be friendly with partial colorblindness, and can be modified in the indicator settings.

Ultimate BK MA's Pro - CryptoProToolsAn All-In-One indicator for those using The BOSS method by Brandon Kelly
0
The Free version of this indicator is just the essential BK SMA's but allows for no customization.
With the Pro version you get the ability to switch from SMA's (Simple Moving Average) and use any of the following:
- SMA - Simple
- EMA - Exponential
- DEMA - Double Exponential
- WMA - Weighted
- VWMA - Volume Weighted
- TEMA - Triple Exponential
- HMA - Hull
- SMMA - Smoothed
We've added quick Alert settings to easily setup TradingView alerts for when the Green crosses over the Orange!
You can also change the source / length / colors of the MA's and Turn arrow signals on or off.


AnimalHunter v0.1This script is for checking the top and bottom at on time.
You can change buy/sell indicator threshold value and index bars.
I'm planning that will add some of interesting features at the future,
At this time, this script is providing only for some people. If you want, please leave comment to this page.
Recommend(and Confirmed that is work enough) Timeframe is 30m or 1hour
Recommend(and Confirmed that is work enough) Ticker Symbol is BITFLYER:BTCJPY
Good tips
----
If you (increase sell|decrease buy) threshold values, my indicators going to more strict to entry position. It means get more accurate(decrease risk), but may loss some good entry point.
If you (decrease sell|increase buy) threshold values, my indicators going to more loose to entry position. It means get more entry times(increase risk but may increase profits), but may loss huge of money.
This is a recommend environment, but maybe you can use this indicator if you change some of settings in my indicator.

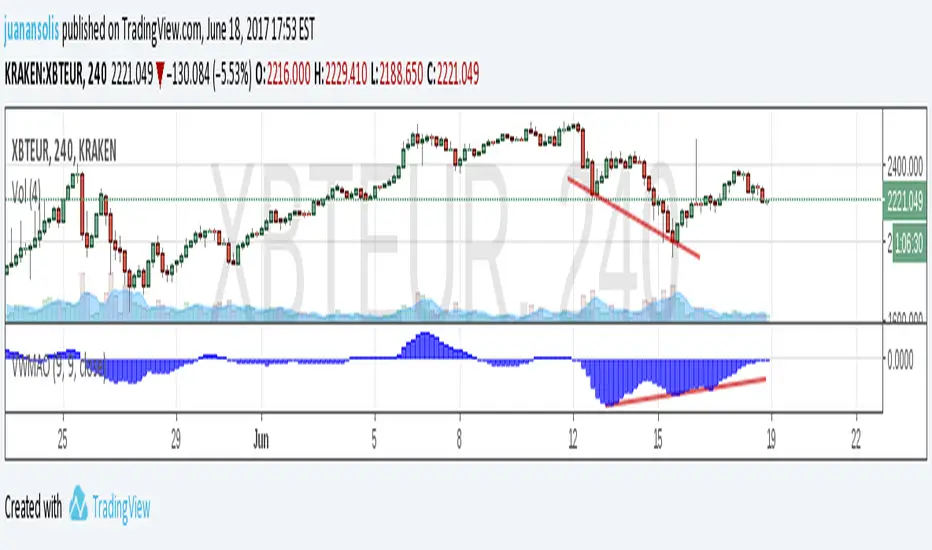
VWMA OscilatorThe Oscillator ranges around 0. Uses the difference between VWMA and an SMA smoothed by an EMA . The most useful are price divergences.
Combining Exponential And Volume WeightingThe related article is copyrighted material from Stocks & Commodities 2009 Oct

Yacine MA Bands ModMashed together the ema-bands from IvanLabrie with some moving average script stuff from ChrisMoody and LazyBear and this is the result. Credit goes to them, 'cause I don't know to how to code tbh. Just copy/pasted stuff untill I got the result I wanted.
Bands work as support/resistance among other things. You can use them to trade breakouts or reversals or whatever.
Combining them with a momentum indicator would probably be useful for timing divergence or OB/OS and stuff like that.
Included moving average types;
SMA
EMA
RMA
WMA
VWMA
HullMA
TilsonMA
TEMA
Not sure if all of them works as they should... y'know since I cant code/script. Looks good to me though.¨
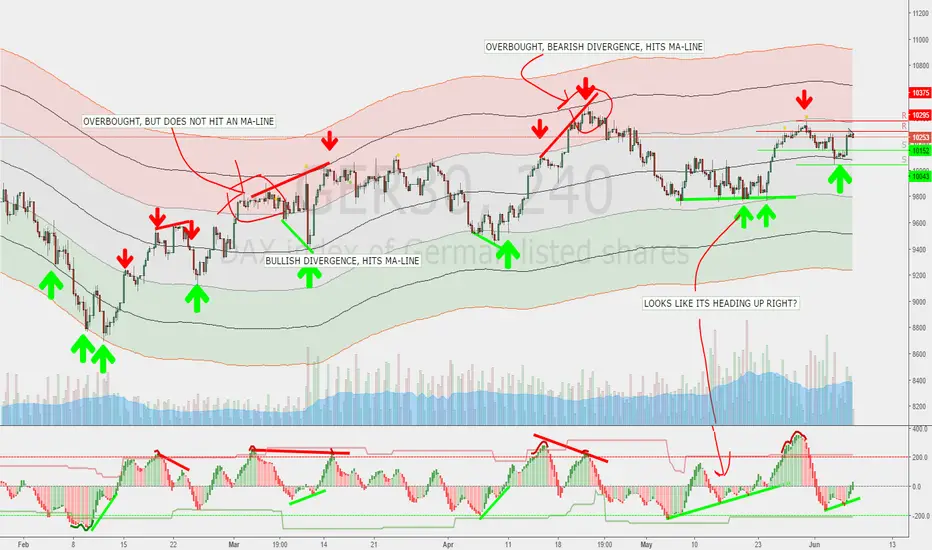
Default should work pretty good for the DAX, But you'll probably want to fiddle a bit with the settings.
Here's a pic of how they can be used. Ofc everything looks simple in hindsight, but you get the point.
Volume Pressure Composite Average with Bands by @XeL_ArjonaVOLUME PRESSURE COMPOSITE AVERAGE WITH BANDS
Ver. 1.0.beta.10.08.2015
By Ricardo M Arjona @XeL_Arjona
DISCLAIMER:
The Following indicator/code IS NOT intended to be a formal investment advice or recommendation by the author, nor should be construed as such. Users will be fully responsible by their use regarding their own trading vehicles/assets.
The embedded code and ideas within this work are FREELY AND PUBLICLY available on the Web for NON LUCRATIVE ACTIVITIES and must remain as is.
Pine Script code MOD's and adaptations by @XeL_Arjona with special mention in regard of:
Buy (Bull) and Sell (Bear) "Power Balance Algorithm" by :
Stocks & Commodities V. 21:10 (68-72):
"Bull And Bear Balance Indicator by Vadim Gimelfarb"
Adjusted Exponential Adaptation from original Volume Weighted Moving Average (VEMA) by @XeL_Arjona with help given at the @pinescript chat room with special mention to @RicardoSantos
Color Cloud Fill Condition algorithm by @ChrisMoody
WHAT IS THIS?
The following indicators try to acknowledge in a K-I-S-S approach to the eye (Keep-It-Simple-Stupid), the two most important aspects of nearly every trading vehicle: -- PRICE ACTION IN RELATION BY IT'S VOLUME --
A) My approach is to make this indicator both as a "Trend Follower" as well as a Volatility expressed in the Bands which are the weighting basis of the trend given their "Cross Signal" given by the Buy & Sell Volume Pressures algorithm. >
B) Please experiment with lookback periods against different timeframes. Given the nature of the Volume Mathematical Monster this kind of study is and in concordance with Price Action; at first glance I've noted that both in short as in long term periods, the indicator tends to adapt quite well to general price action conditions. BE ADVICED THIS IS EXPERIMENTAL!
C) ALL NEW IDEAS OR MODIFICATIONS to these indicator(s) are Welcome in favor to deploy a better and more accurate readings. I will be very glad to be notified at Twitter or TradingVew accounts at: @XeL_Arjona
Any important addition to this work MUST REMAIN PUBLIC by means of CreativeCommons CC & TradingView. --- All Authorship Rights RESERVED 2015 ---

Elastic Volume Weighted Moving Average & Envelope [LazyBear]Elastic Volume Weighted Moving Average (eVWMA) is a statistical measure using the volume to define the period of the moving average. The eVWMA can be looked at as an approximation to the average price paid per share. Multiplier is usually the number of shares, but it can be approximated using cumulative sum of volume (Enable it via "Use Cumulative Volume" option) or sum of volume over "n" periods.
I have also added an option to draw eVWMA envelope (eVWMA on HLC).
More info:
christian-fries.de
List of all my indicators:
- Chart:
- GDoc: docs.google.com

Ultimate Moving Average-Multi-TimeFrame-7 MA TypesAll Moving Averages and Features Built In To ONE Indicator. The Only Moving Average Indicator You Will Need. Details In 1st Post.