Multi-VWAP Pro (HP) + Alerts - par alphaomega18Multi-VWAP Pro High-Precision (D/W/M) – by alphaomega18
🚀 Overview
Elevate your institutional analysis with the Multi-VWAP Pro High-Precision, a comprehensive tool designed for traders who demand surgical accuracy.
Most standard VWAP indicators lag or shift when changing timeframes. This script solves that by using a 1-minute data polling engine (request.security), ensuring your Daily, Weekly, and Monthly levels remain rock-solid and accurate, whether you are on a 1m, 15m, or 1h chart.
💎 Key Features
High-Precision Engine: Calculation based on 1-minute intraday data for maximum mathematical accuracy.
Multi-Timeframe Anchors: View Daily, Weekly, and Monthly VWAPs simultaneously.
Dynamic Color Logic: The Daily VWAP turns Green when the price is above and Red when below for instant trend bias.
Triple SD Bands: 3 fully customizable Standard Deviation bands for each timeframe to identify exhaustion zones.
Smart Alerts: Fully programmable notifications for price crosses on all levels.
Clean Labels: Real-time labels on the price scale for a professional, organized look.
📈 Trading Strategy: The Power of Confluence
Using three different VWAP anchors allows you to see the market through multiple lenses. Here is how to use this tool:
1. The Institutional Confluence
The strongest setups occur when two or more VWAP lines overlap.
The Setup: If the Daily VWAP clusters with the Weekly VWAP, it creates a "Hard Floor/Ceiling."
The Trade: Look for high-probability bounces in these zones where institutions defend their average price.
2. Mean Reversion with SD3 Bands
The 3rd Standard Deviation (SD3) represents price extremes.
The Trade: When price pierces a Daily SD3, look for a reversal back toward the VWAP (Mean Reversion), especially if it aligns with a Weekly or Monthly SD2 band.
3. Trend Confirmation
Bullish Bias: If the Daily VWAP is Green, prioritize "Buy the Dip" on lower SD bands.
Bearish Bias: If the Daily VWAP is Red, prioritize "Sell the Rip" on upper SD bands.
💡 Pro Tip for my Followers
"Alignment is king. When the Daily, Weekly, and Monthly VWAPs all slope in the same direction, you have a high-conviction trend. Follow me for more high-precision tools and market insights!"
🛠 Settings & Customization
Visibility: Toggle any VWAP or SD band on/off.
Full Color Control: Pick your own colors for Weekly and Monthly lines.
Adjustable Multipliers: Fine-tune the volatility bands (SD1, SD2, SD3) for any asset.
Vwapband

Daytrading Suite v6.4: Neon TPO + FVG + IB Lines (Stable)Here is the complete **Trading Manual & Strategy Guide** for the **Master Daytrading Suite (Neon + IB Edition)**.
This guide explains exactly **when** to trade and **how** to execute trades using the tools in the script.
---
# 📘 MASTER TRADING MANUAL (Neon + IB)
### 1. THE BASICS
* **Best Assets:** BTCUSDT & ETHUSDT (Futures).
* **Best Timeframe:** 5 Minutes (Entry) / 15 Minutes (Trend).
* **Key Session:** New York Session (High Volatility).
* **Golden Rule:** Never go **LONG** inside a Red Supply Zone. Never go **SHORT** inside a Green Demand Zone.
---
### 2. THE INDICATORS (Legend)
| Indicator | Color | Function | How to use |
| --- | --- | --- | --- |
| **Supply Zone** | 🟥 **Red Box** | Resistance | Look for Short setups here. |
| **Demand Zone** | 🟩 **Green Box** | Support | Look for Long setups here. |
| **Golden Pocket** | 🟧 **Orange** | Retracement | The "Sweet Spot" for trend entries (Fib 0.618). |
| **VWAP** | 🔵 **Blue Line** | Trend Anchor | Price > VWAP = Bullish. Price < VWAP = Bearish. |
| **Initial Balance (IB)** | 🟨 **Yellow Box** | Opening Range | Breakout above = Bullish. Breakdown below = Bearish. |
| **FVG (Gap)** | 🟩/🟥 **Tiny Box** | Trigger | **Green FVG** = Entry Signal for Longs. **Red FVG** = Entry Signal for Shorts. |
---
### 3. STRATEGY A: The Trend Pullback (High Win Rate)
*Use this when the market is trending smoothly.*
#### ✅ HOW TO ENTER A LONG (BUY) POSITION
1. **Trend Check:** Price is trading **ABOVE** the VWAP (Blue Line) and EMA 9 (Yellow Line).
2. **The Wait:** Wait for the price to drop back down (pullback).
3. **The Zone:** Price touches the **Green Demand Zone** OR the **Orange Golden Pocket**.
4. **The Trigger:** A **Green FVG Box** appears on the 5-minute chart.
5. **Execution:** Enter Long. Stop Loss below the recent low. Take Profit at the next Red Zone.
#### 🔻 HOW TO ENTER A SHORT (SELL) POSITION
1. **Trend Check:** Price is trading **BELOW** the VWAP (Blue Line) and EMA 9 (Yellow Line).
2. **The Wait:** Wait for the price to rally up (pullback).
3. **The Zone:** Price touches the **Red Supply Zone** OR the **Orange Golden Pocket**.
4. **The Trigger:** A **Red FVG Box** appears on the 5-minute chart.
5. **Execution:** Enter Short. Stop Loss above the recent high. Take Profit at the next Green Zone.
---
### 4. STRATEGY B: The IB Breakout (Volatility)
*Use this specifically after the first hour of the New York Session (approx. 10:30 NY time).*
* **The Setup:** Look at the **Yellow Box (Initial Balance)** which marks the high/low of the first hour.
* **Bullish Breakout:** If a candle closes **above** the Yellow Box + Price is above VWAP → **Go Long**.
* **Bearish Breakdown:** If a candle closes **below** the Yellow Box + Price is below VWAP → **Go Short**.
* **The Trap (Fakeout):** If price breaks out but immediately falls back inside the Yellow Box, close the trade immediately.
---
### 5. DAILY ROUTINE (Checklist)
1. **Open TradingView:** Switch to the **15m Chart**.
2. **Check Context:** Where are we? Are we near a big Red Box (Supply) or Green Box (Demand)?
3. **Check Trend:** Is price above or below the Blue VWAP line?
4. **Wait for the Open:** Let the first hour of New York pass (to form the Yellow IB Box).
5. **Set Alerts:** Right-click the chart and set alerts for "IB Breakout" or "Golden Pocket".
6. **Execute:** Switch to the **5m Chart** to find your entry trigger (FVG).
---
### 6. RISK MANAGEMENT RULES
* **Stop Loss:** NEVER trade without one. Place it just outside the FVG box or the Zone.
* **Risk per Trade:** 1% to 2% of your account maximum.
* **No Trade Zone:** If the price is "chopping" (moving sideways) inside the Yellow IB Box, **do not trade**. Wait for a breakout.

Volume Weighted Average Price @Marx_CapitalSimple VWAP indicator edited to not connect the lines between sessions for a cleaner look without vertical lines at session ends.
Session end and start times are customizable.

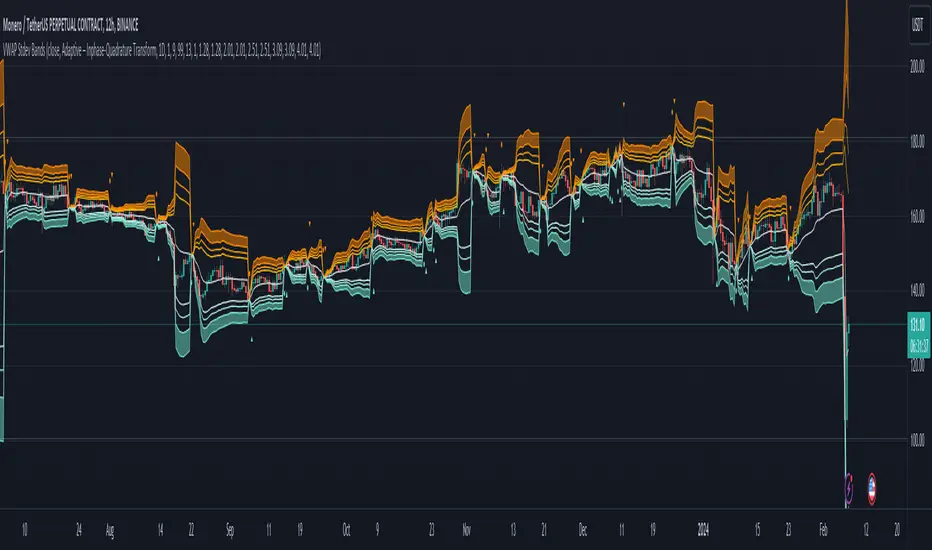
Adaptive VWAP Stdev BandsIntroduction
Heyo, here are some adaptive VWAP Standard Deviation Bands with nice colors.
I used Ehlers dominant cycle theories and ZLSMA smoothing to create this indicator.
You can choose between different algorithms to determine the dominant cycle and this will be used as reset period.
Everytime bar_index can be divided through the dominant cycle length and the result is zero VWAP resets if have chosen an adaptive mode in the settings.
The other reset event you can use is just a simple time-based event, e.g. reset every day.
Usage
I think people buy/sell when it reaches extreme zones.
Enjoy!
---
Credits to:
@SandroTurriate - VWAP Stdev Bands
@blackcat1402 - Dominant Cycle Analysis
@DasanC - Dominant Cycle Analysis
@veryfid - ZLSMA
(Sry, too lazy for linking)
I took parts of their code. Ty guys for your work! Just awesome.